06 July 2022
Dynamic analysis of firmware components in IoT devices
Firmware analysis is an essential part of security research and targeted search for vulnerabilities in IoT products, vehicle components, industrial control systems, and a multitude of other types of software/hardware systems designed for various purposes.
The overall size of device firmware and the volume of software code in individual binary files can often be quite large. In such cases, it can be a good idea to conduct dynamic analysis of the firmware to save time and effort. Dynamic analysis allows the researcher to see how specific code works, find the call chain that leads to the execution of a specific branch, do fuzzing, and much more.
This article examines conventional methods of dynamic analysis:
- Combining QEMU and GDB, and debugging directly on the target system.
It also discusses some less obvious but at the same time more interesting methods:
- The Renode emulator, a tool for full system emulation that has largely been neglected by the security research community.
- The Qiling framework, a tool for emulating APIs of operating systems and environments (such as UEFI). This tool is inherently similar to
qemu-user, but is highly flexible and adaptable because it is written in Python, a high-level programming language.
Each tool has its own strong points and shortcomings, and can be suitable for a specific range of tasks to varying degrees.
We will demonstrate some of the capabilities of these tools using the firmware of a network video recorder from a major manufacturer. It is worth noting that our research will be conducted without having the actual device on hand.
As a bonus case study, we will demonstrate debugging using GDB on another device that we have on hand – a head unit from a major car brand.
Research object and procedure
Using the analysis of a network video recorder’s firmware as an example, we will show some of the difficulties encountered by security researchers when analyzing device firmware and possible ways to overcome these difficulties using a modern and effective toolset.
The general workflow of a firmware researcher can be divided into several stages:
- Determine the format of the firmware, unpack it, and analyze the component parts of multi-component firmware.
- Conduct an initial analysis of the data obtained: determine the target architecture, the OS, and the purpose of individual files.
- Conduct static analysis of those parts of the firmware which are of interest, and determine whether dynamic analysis is necessary and what its scope should be.
- Choose targets for dynamic analysis and tools for implementing it.
- Attempt to run the component to be analyzed using the tool selected.
- Set up “stubs” to bypass parts of the software that either do not require emulation or cannot be emulated, and to define the initial state.
- Analyze the results of running the code being analyzed using the selected tool.
The video recorder selected for our firmware research is based on the HiSilicon platform and runs Linux. The firmware downloaded from the manufacturer’s website consists of a single file in which the binwalk tool detected a CramFS file system. After unpacking the file, we find uImage – a combined image of the Linux kernel and initramfs – as well as several encrypted scripts and TAR archives.
DECIMAL       HEXADECIMAL     DESCRIPTION
--------------------------------------------------------------------------------
0             0x0             uImage header, header size: 64 bytes, header CRC: 0xCA9A1902, created: 2019-08-23 07:16:16, image size: 4414954 bytes, Data Address: 0x40008000, Entry Point: 0x40008000, data CRC: 0xDE0F30AC, OS: Linux, CPU: ARM, image type: OS Kernel Image, compression type: none, image name: "Linux-3.18.20"
64            0x40            Linux kernel ARM boot executable zImage (little-endian)
2464          0x9A0           device tree image (dtb)
16560         0x40B0          LZMA compressed data, properties: 0x5D, dictionary size: 33554432 bytes, uncompressed size: -1 bytes
4401848       0x432AB8        device tree image (dtb)
After obtaining basic information about the object of our research, we attempt to employ the tools mentioned above to obtain more information, including additional files. Among these files, we identify potential targets for further analysis.
System-level emulation using Renode
Renode is a tool designed to emulate the entire target system, including the interactions between multiple virtual processors, each of which may have its own architecture and firmware, virtual memory chips, sensors, displays and other peripheral devices. Renode also enables you to interlink emulated hardware with real hardware implemented as a programmable logic device (an FPGA chip).
It is worth noting that, although Renode is primarily designed to emulate Embedded/IoT devices running embedded operating systems, it can also run full-fledged operating systems such as Linux or QNX. The project’s repository on GitHub provides relevant examples of these different scenarios. Please refer to documentation for a list of debug boards for which Renode provides out-of-the-box support for at least some peripherals.
Renode developers primarily position it as a tool designed to make embedded software development, debugging, and automated testing easier. However, it can also be used as a dynamic analysis tool to analyze the behavior of systems. Useful features provided by Renode include:
- Support for ARM Cortex-A/M, x86, RISC-V, SPARC, and POWER architectures
- Capability to emulate any peripheral device in C#
- Interconnection of virtual devices using I2C, SPI, USB, Ethernet, and other interfaces
- Capability to connect to the emulated system with the GDB debugger for debugging purposes, and to analyze and change CPU registers, the state of system memory, virtual devices, and much more at any time, including by scripting.
- Capability to write handlers for specific events (for example, reading from / writing to specific memory addresses) in Python or C#.
- Capability to write plug-ins in .NET languages to implement new commands, such as commands that import function and variable names from IDA/Ghidra SRE.
Describing the emulated platform
Peripheral devices that are part of single-chip systems are normally available via Memory Mapped I/O (MMIO) – physical memory regions to which registers of the corresponding peripheral modules are mapped. Renode provides the capability to build an on-chip system from building blocks using a configuration file with the .repl (REnode PLatform) extension that describes which devices should be mapped to which memory addresses.
Information about available peripheral devices and the memory map for the platform employed can be found in SoC documentation (if publicly available). If the documentation is not available, you can find this information through other means, such as by analyzing the contents of the Device Tree Blob (DTB), a data block describing the platform that is required by the Linux kernel to run Linux on embedded devices.
In the firmware being analyzed, the DTB block is attached to the end of the uImage file (according to information from the binwalk tool). After converting the DTB into a readable format (DTS) using the dtc tool, we can use it to create a platform description for Renode:
uart0: UART.PL011 @ sysbus 0x12080000
    -> gic@6
    size: 0x1000

uart1: UART.PL011 @ sysbus 0x12090000
    -> gic@7
    size: 0x1000

uart2: UART.PL011 @ sysbus 0x120a0000
    -> gic@8
    size: 0x1000

uart3: UART.PL011 @ sysbus 0x12130000
    -> gic@20
    size: 0x1000

timer0: Timers.SP804 @ sysbus 0x12000000
    -> gic@1

memory: Memory.MappedMemory @ sysbus 0x40000000
    size: 0x8000000

sysCtl: Miscellaneous.ArmSysCtl @ sysbus <0x12050000, +0x1000>
    procId: 0x0C000191

pl310: Cache.PL310 @ sysbus <0x10700000, +0x10000>

gic: IRQControllers.GIC @ {
        sysbus new Bus.BusMultiRegistration { address: 0x10301000; size: 0x1000; region: "distributor"};
        sysbus new Bus.BusMultiRegistration { address: 0x10300100; size: 0x100; region: "cpuInterface"}
    }
    0 -> cpu@0
    itLinesNumber: 2
    numberOfCPUs: 1

cpu: CPU.Arm @ sysbus
    cpuType: "cortex-a9"

sysbus:
    init:
        Tag <0x12080000, 0x12080FFF> "UART0"
        Tag <0x12090000, 0x12090FFF> "UART1"
        Tag <0x120A0000, 0x120A0FFF> "UART2"
The above platform description for Renode was created using a minimal set of peripheral devices listed in the Device Tree, which includes serial interfaces (UART), the system clock, RAM, and an interrupt controller. This should be enough to at least run something, and then we can proceed according to the situation. An example of a serial interface description in DTS is shown below:
uart@12080000 {
    compatible = "arm,pl011\0arm,primecell";
    reg = <0x12080000 0x1000>;
    interrupts = <0x00 0x06 0x04>;
    clocks = <0x02 0x23>;
    clock-names = "apb_pclk";
    status = "okay";
};
Luckily for us, all the necessary devices in this case were already available in the Renode library: the PL011 serial port, the SP804 clock, and the standard ARM interrupt controller. However, in many cases, a minimal implementation of a specific device that is not included in Renode has to be written or, alternatively, stub tags can be used instead (as described below).
Starting emulation
An initialization script has to be prepared to run something useful on the platform obtained. The script normally loads executable code into the platform’s memory, configures processor registers, sets additional event handlers, configures the output of debug messages (if necessary), etc.
:name: HiSilicon
:description: To run Linux on HiSilicon

using sysbus
$name?="HiSilicon"
mach create $name
machine LoadPlatformDescription @platforms/cpus/hisilicon.repl
logLevel 0
sysbus LogAllPeripheralsAccess true

### create externals ###
showAnalyzer sysbus.uart0

### redirect memory for Linux ###
sysbus Redirect 0xC0000000 0x40000000 0x8000000

### load binaries ###
sysbus LoadBinary "/home/research/out/uImage" 0x40008000
sysbus LoadAtags "console=ttyS0,115200 mem=128M@0x40000000 nosmp maxcpus=0" 0x8000000 0x40000100


### set registers ###
cpu SetRegisterUnsafe 2 0x40000100 # atags
cpu PC 0x40008040
The script loads the uImage file into the platform’s memory at the address taken from the binwalk output, configures kernel arguments (Linux expects ATAGS to be passed at the offset of 0x100 bytes from the start of RAM, and the address is also passed in the r2 register), and passes control to address 0x40008040 because the first 0x40 bytes are taken by the uImage header.
The initialization script may also perform many additional actions, such as setting different processor registers (e.g., if code execution does not begin from the entry point) or write any value to the platform memory (e.g., if it’s necessary to patch specific instructions in the executable code loaded at previous steps). It can also enable the GDB server or print debug information about all peripheral access attempts:
# Start GDB server on localhost:3333
machine StartGdbServer 3333

# Write 2 NOP instructions (ARM Thumb) at address 0xdeadbeef
sysbus WriteDoubleWord 0xdeadbeef 0x46c046c0

# Print all queries to virtual devices to console
sysbus LogAllPeripheralsAccess true
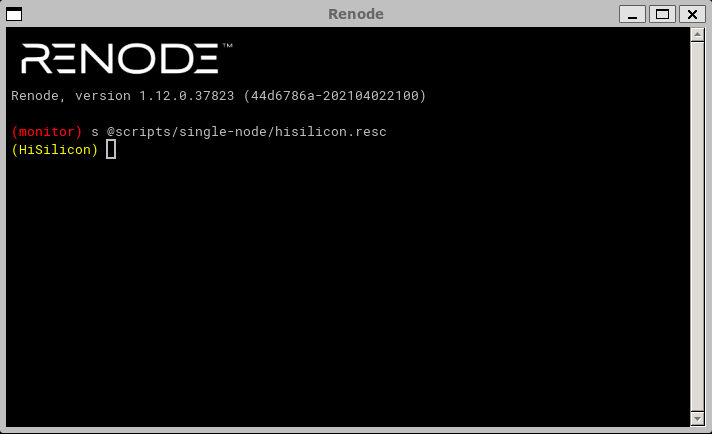
The Renode emulator provides enough capabilities to quickly start the dynamic analysis of the firmware being studied. Now we can start emulation:
The console output shows that the emulator apparently entered an infinite loop while checking some condition (register value in memory) and refuses to continue execution:
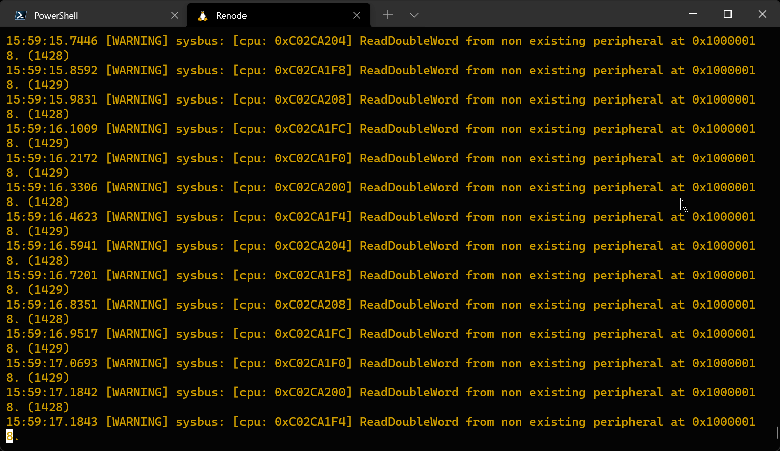
We start by looking at the unpacked Device Tree and try to find out which device corresponds to the address requested. We determine that this should be the address of the Flash Memory Controller (NOR/NAND memory controller):
flash-memory-controller@10000000 {
    compatible = "hisilicon,hisi-fmc";
    reg = <0x10000000 0x1000 0x14000000 0x10000>;
    reg-names = "control\0memory";
    clocks = <0x02 0x2c>;
    #address-cells = <0x01>;
    #size-cells = <0x00>;
...
We can try to trick the system into continuing execution. Instead of adding a full-fledged Flash memory controller to the platform description file, we can try to emulate only the register requested by adding a stub tag. But first we need to find out which value is expected by the kernel in the register located at address 0x10000018 to continue execution. Through a search on GitHub, we find the source code of the controller’s driver in the Linux kernel (drivers/mtd/spi-nor/hisi-sfc.c) and we notice that the register in question is used in the wait_op_finish function:
static inline int wait_op_finish(struct hifmc_host *host)
{
    u32 reg;

    return readl_poll_timeout(host->regbase + FMC_INT, reg,
        (reg & FMC_INT_OP_DONE), 0, FMC_WAIT_TIMEOUT);
}
The FMC_INT_OP_DONE constant is equal to 1. Therefore, to skip the loop, the kernel needs to read 1 from the FMC_INT register. This can be ensured by adding the following tag after Tag <0x120A0000, 0x120A0FFF> "UART2" in the platform description:
Tag <0x10000018, 0x1000001C> "FMCINT" 0x1
Now the value 1 will always be read at address 0x10000018. In addition to setting a fixed value, Renode enables you use Python scripts embedded in the platform description to implement a more sophisticated logic for handling address-based read/write operations. Examples of this usage scenario can be found in startup scripts and platform description files provided with Renode.
Next, we restart the emulator. Now, the window of the terminal connected to the virtual serial port uart0 displays the standard Linux shell, with which you can interact as usual:
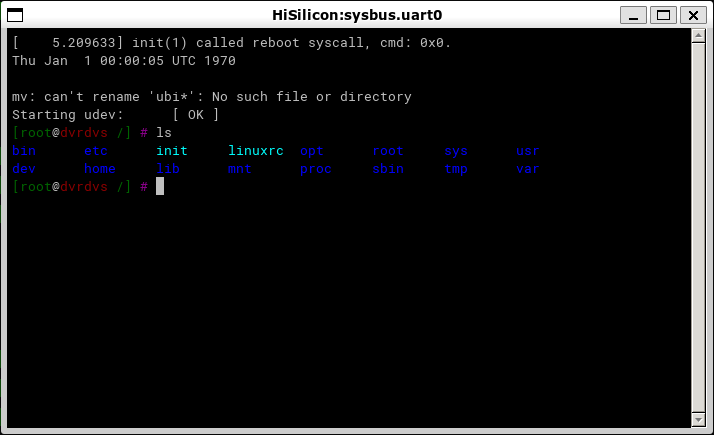
This means that we were able to partially run the firmware of the network video recorder without actually having the recorder on hand. In the next steps, we can use the tools available in the emulated file system to decrypt the encrypted firmware files, extract kernel modules that provide the recorder functionality and analyze their logic, etc.
Exchanging data with the emulated system
Previously, we extracted several encrypted tar.lzma archives from the video recorder’s firmware file. After a quick analysis of the files and scripts present in the system running in Renode, we can see that these archives are decrypted using the /bin/ded application, which in turn queries the /dev/hikded device provided by the hik_ded.ko kernel module. This kernel module in its turn queries another kernel module, hik_hal.ko, which actually decrypts the encryption key and the encrypted archive. To avoid wasting time on a detailed analysis of the entire process using static analysis tools, we can run this chain in the emulator to complete processing the encrypted files and then download the decrypted archives.
First we need to find a way to transfer the encrypted files to the emulated system. The only on-chip devices available in our virtual system that can be used for communication are the RAM and serial ports. However, the total size of the archives is too large for transferring them through a serial port (with its low transfer speed) to be practicable. Therefore, we will try to transfer them through RAM. As regards virtual serial ports, Renode supports setting up communication with them from a host system via the TCP server or creating a pty device (the latter works only in Linux and macOS).
We use a familiar command to load an encrypted file into the memory of the virtual machine:
sysbus LoadBinary "/home/research/out/sys_app.tar.lzma" 0x48000000
The sys_app.tar.lzma file will be loaded into physical memory at the address specified. We can retrieve it from there by using the /dev/mem device, which can be used in Linux to read and write directly to physical memory.
dd if=/dev/mem of=/sys_app.tar.lzma.encrypted bs=1M seek=1152 count=10
Now we can decrypt the data using standard tools included in the firmware:
ded -d /sys_app.tar.lzma.encrypted /sys_app.tar.lzma
tar -atvf /sys_app.tar.lzma
After verifying that the file was successfully decrypted, we need to transfer the decryption results from the virtual machine. This can also be done through /dev/mem. However, the out-of-the-box configuration of Renode does not include a command for saving a fragment of physical memory contents to a file, while commands that provide communication with memory through the GDB server work with virtual addresses. We’ll have to implement this capability with a simple plug-in:
using System;
...

namespace Antmicro.Renode.Plugins.MemoryDumpPlugin {
    public sealed class MemoryDumpCommand : Command {
        public override void PrintHelp(ICommandInteraction writer) {
            base.PrintHelp(writer);
            writer.WriteLine(String.Format("{0} address length \"file\"", Name));
        }

        [Runnable]
        public void Run(ICommandInteraction writer, HexToken address, HexToken length, StringToken fileName) {
            byte[] memory = monitor.Machine.SystemBus.ReadBytes((ulong)address.Value, (int)length.Value);
            File.WriteAllBytes(fileName.Value, memory);
        }

        public MemoryDumpCommand(Monitor monitor) : base(monitor, "dump_memory", "Dump memory to file.") { }
    }
}
After loading the plug-in, the Renode console will support a new command, dump_memory, which can be used to extract data from the VM memory and unpack the archive. Further analysis of the files extracted is beyond the scope of this article and will be omitted.
Conclusions on this tool
We have examined a practical example of using the Renode emulator to run and decrypt firmware files from a real-world device. In this case, thanks to Renode’s support of the peripherals used in the HiSilicon SoC, we were able to use a fully functional Linux terminal without having to write any code.
At the same time, where necessary, the modular architecture of the emulator and its scripting capabilities make it relatively easy to implement support for any lacking functionality at a level that is sufficient to conduct research.
The emulator’s versatility enables it to run full-fledged operating systems such as Linux or QNX as well as small embedded real-time operating systems such as FreeRTOS, mBed OS, embOS, etc.
One of the distinguishing features of this tool is its use of system-level emulation. As a result of this, it can be difficult to use it to fuzz-test or debug a user-space application that runs in an emulated operating system.
The tool’s shortcomings include the lack of detailed documentation, with existing documentation describing only the most basic usage scenarios. When implementing something more complicated, such as a new peripheral device, or when trying to understand how a specific built-in command works, you have to repeatedly refer to the project repository on GitHub and study the source code of both the emulator itself and bundled peripheral devices.
Application-level debugging using GDB and QEMU
Strictly speaking, in our particular case third-party tools are not really required for dynamic analysis of user-space applications: the operating system we are using, i.e., Linux, enables limited debugging of these applications using the standard GDB.
The firmware to be analyzed is designed for the ARM architecture, while our research is being conducted on an x86_64 system, so we will need QEMU with support for user-mode ARM emulation to run ELF files.
To conduct our experiment, we need to extract the file system that we have already seen in the Renode terminal from the firmware to be analyzed and to install the qemu-user and gdb-multiarch packages:
sudo apt install gcc-arm-linux-gnueabihf libc6-dev-armhf-cross qemu-user-static gdb-multiarch
Now we can run the chroot command and switch to an environment that is similar to the one we saw in Renode. QEMU, which was installed at the previous step, provides transparent emulation of ARM instructions. However, when using this approach, only user-level programs will be available for running and debugging because the Linux kernel in the chroot environment will be inherited from the host operating system.
Thanks to the built-in GDB server, QEMU is able to debug Linux applications that were compiled for the ARM architecture by using the GDB debugger on an x86 system. As an example, we will try to debug /bin/ded:
qemu-arm-static -g 9999 -L ~/out/cpio/bin/ded
Next, we start GDB in another terminal window:
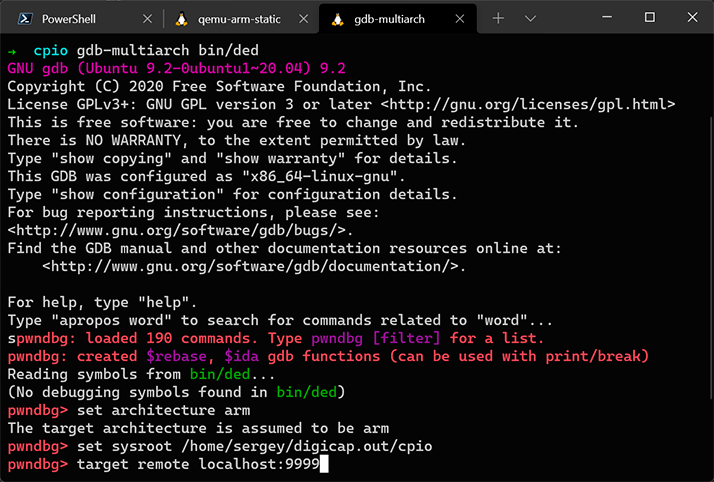
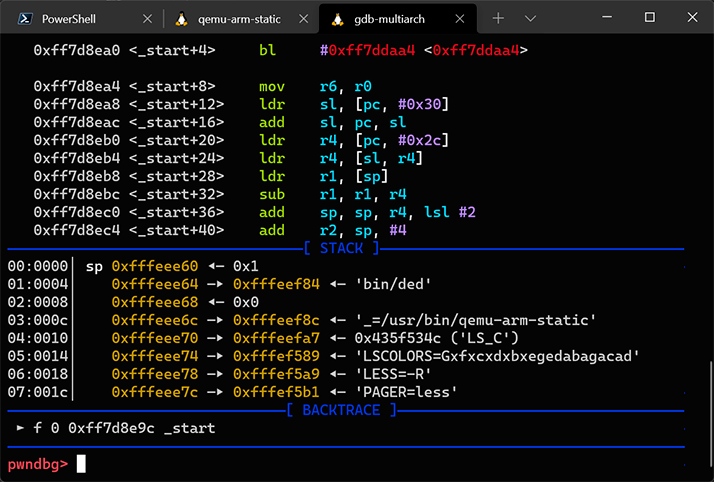
The debugger started and stopped at the entry point of /bin/ded.
Conclusions on this tool
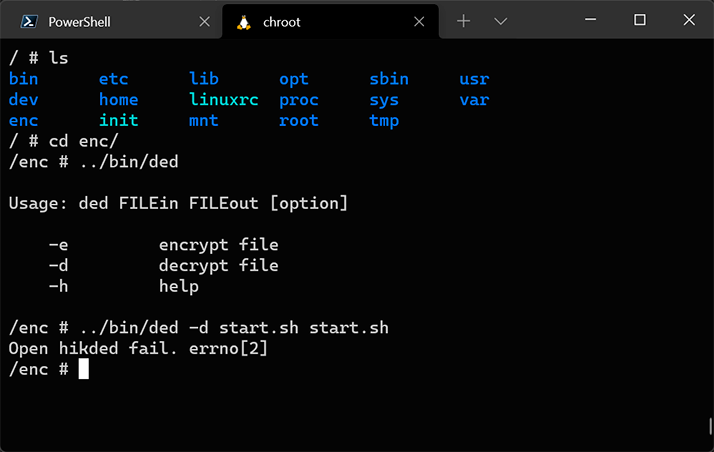
Obviously, one of the limitations of this approach (in contrast to Renode) is that, when using qemu-user, we cannot load the Linux kernel and its modules, which implement a substantial part of the functionality in the case of the firmware we are analyzing. Specifically, the /bin/ded tool from the above example returns an error, even though it runs flawlessly and correctly decrypts encrypted files when it is run in the Renode emulator. In addition, this approach will not work if the firmware being analyzed is not based on Linux. This is because qemu-user works by converting ARM executable code to x86_64 instructions and directly relays system calls to the Linux kernel. However, the method we will examine next does not have this limitation.
Application-level debugging using the Qiling Framework
Qiling is an advanced multi-platform framework for emulating binary files. It can emulate a multitude of platforms and environments, including:
- Emulation of Windows, MacOS, Linux, QNX, BSD, UEFI, DOS, MBR, and Ethereum Virtual Machine
- Support for x86, x86_64, ARM, ARM64, MIPS, and 8086 architectures
- Support for various executable file formats, including PE, Mach-O, ELF, COM, and MBR.
The framework itself was written in Python, which makes adapting its functionality to our specific needs sufficiently easy. The Qiling Framework uses the Unicorn engine, which is simply an emulator of machine instructions, while Qiling provides high-level functions such as file system emulation, dynamic libraries, loading various formats of executable files, etc.
Compared to QEMU, the Qiling Framework can emulate more platforms, provides flexible configuration of the emulation process, including the capability to modify executing code on-the-fly. In addition, it is a cross-platform framework, which means it can be used to emulate Windows or QNX executables on Linux, and vice versa. The Qiling Framework repository also contains examples of running the AFL fuzzer in Unicorn mode for Linux and QNX executables. We’ll take advantage of this later.
For our first encounter with Qiling, our equivalent hello-world example will be to use Qiling to start the familiar ded tool from the firmware being analyzed. To do so, we will copy the device file system to examples/rootfs/hikroot and write the following simple script named examples/hikded_arm_linux.py:
import sys
sys.path.append("..")

from qiling import Qiling
from qiling.const import QL_VERBOSE

def run_sandbox(path, rootfs, verbose):
    ql = Qiling(path, rootfs, verbose = verbose)
    ql.run()

if __name__ == "__main__":
    run_sandbox(["rootfs/hikroot/bin/ded"], "rootfs/hikroot", QL_VERBOSE.DEFAULT)
When operating at the DEFAULT logging verbosity level, the Qiling Framework sends information about emulated system calls to the console similarly to the strace Linux tool.
Now we can try to start the AFL++ fuzzer, which will use Qiling as a runtime environment. In most cases, this type of fuzzer will run very slowly. However, thanks to the fact that the Qiling Framework can emulate a broad variety of environments and operating systems, as well as its support for UEFI and various microprocessor architectures, in some cases this may be the only way to do fuzzing with minimal effort.
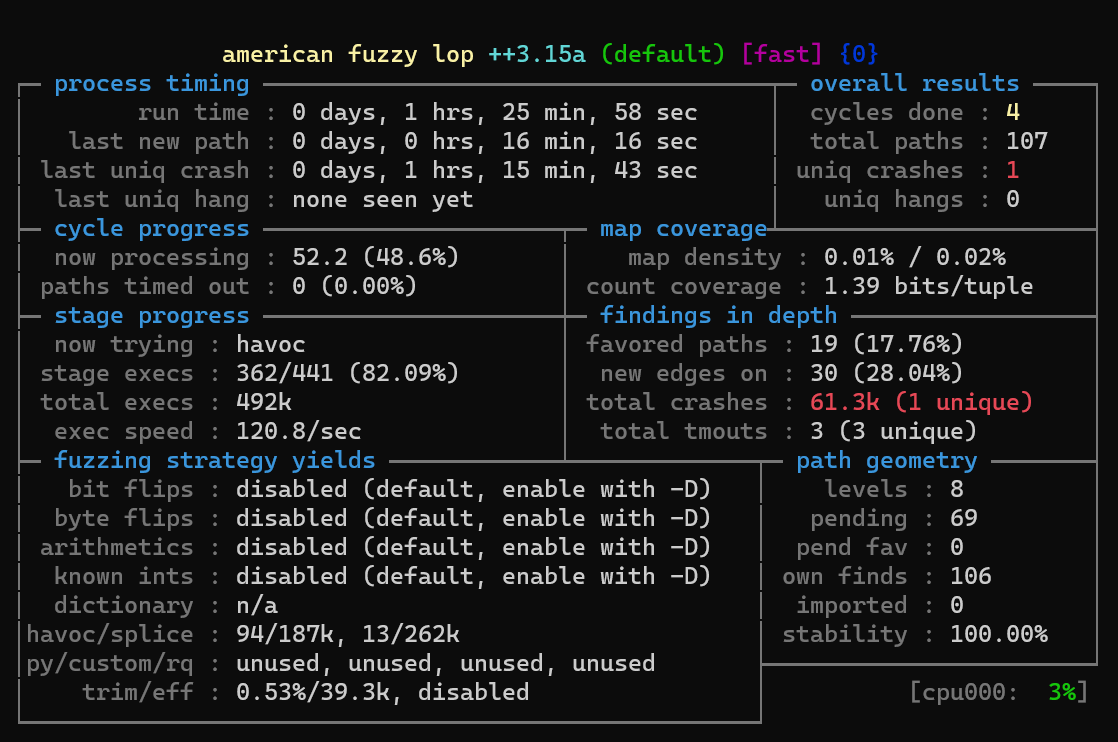
The ded tool examined earlier is not suitable as a target for fuzzing because its code is too simple and will return an error and exit due to the inability to open the /dev/hikded device regardless of the input data. This is why we will use another tool, hrsaverify, from the same firmware. It is used to validate encrypted files and takes the path to the file to be validated as an argument. The Qiling Framework already has several examples of running the AFL++ fuzzer in the examples/fuzzing directory of its repository. We will adapt the example named linux_x8664 to run hrsaverify. The modified script for running the fuzzer is shown below:
import unicornafl as UcAfl
UcAfl.monkeypatch()

import os, sys
from typing import Any, Optional

sys.path.append("../../..")
from qiling import Qiling
from qiling.const import QL_VERBOSE
from qiling.extensions import pipe

def main(input_file: str):
    ql = Qiling(["../../rootfs/hikroot/usr/bin/hrsaverify", "/test"], "../../rootfs/hikroot",
            verbose=QL_VERBOSE.OFF, # keep qiling logging off
            console=False,          # thwart program output
            stdin=None, stdout=None, stderr=None) # don't care about stdin/stdout

    def place_input_callback(uc: UcAfl.Uc, input: bytes, persistent_round: int, data: Any) -> Optional[bool]:
        """Called with every newly generated input."""
        with open("../../rootfs/hikroot/test", "wb") as f:
            f.write(input)

    def start_afl(_ql: Qiling):
        """Callback from inside."""
        # We start our AFL forkserver or run once if AFL is not available.
        # This will only return after the fuzzing stopped.
        try:
            if not _ql.uc.afl_fuzz(input_file=input_file,
                                   place_input_callback=place_input_callback, exits=[ql.os.exit_point]):
                _ql.log.warning("Ran once without AFL attached")
                os._exit(0)

        except UcAfl.UcAflError as ex:
            if ex.errno != UcAfl.UC_AFL_RET_CALLED_TWICE:
                raise

    # Image base address
    ba = 0x10000
    # Set a hook on main() to let unicorn fork and start instrumentation
    ql.hook_address(callback=start_afl, address=ba + 0x8d8)
    # Okay, ready to roll
    ql.run()

if __name__ == "__main__":
    if len(sys.argv) == 1:
        raise ValueError("No input file provided.")

    main(sys.argv[1])
The first thing we should look for is the base address of the executable file (in our case, 0x10000), the address of the main function. Sometimes it is necessary to additionally set hooks on other addresses that, when encountered, should be considered as a crash by the fuzzer. For example, when running AFL in a QNX environment (in the qnx_arm directory), this type of additional handler is set for the address of the SignalKill function in libc. In the case of hrsaverify, no additional handlers are needed. It should also be kept in mind that all files that must be available to the running application should be put into sysroot, and their relative paths should be passed (in this case, ../../rootfs/hikroot/).
AFL++ is started with the following command:
AFL_AUTORESUME=1 AFL_PATH="$(realpath ./AFLplusplus)" PATH="$AFL_PATH:$PATH" afl-fuzz -i afl_inputs -o afl_outputs -U -- python ./fuzz_arm_linux.py @@
The AFL fuzzer will start, and after some time we will see some crashes:
Conclusions on this tool
Qiling is a promising tool whose main advantages are its high flexibility, extensibility, and support for a broad variety of architectures and environments. The framework can serve as a substitute for qemu-user in cases where using the latter is not possible (for example, unsupported target OS or the lack of required additional capabilities, such as setting arbitrary handles for any memory addresses, special handling of interrupts, etc.). However, its high flexibility and shallow learning curve due to its use of Python also contribute to its low emulation speed.
Bonus: using GDB for debugging on a real-world device
Developers deliberately leave various engineering interfaces (such as the UART console, JTAG, etc.) on many devices’ circuit boards. These interfaces are often deactivated on the software or hardware level, are password-protected, or have some other form of access restriction. However, in many cases an interface is immediately accessible or a researcher is able to gain access to it during research. In such cases, communication with the system being analyzed is possible via the command line or the JTAG debugger.
When using JTAG, you can read or write contents to ROM or RAM, set breakpoints, manage peripheral devices by writing to addresses corresponding to their I/O registers, analyze the state of processor registers, etc.
When using UART, it is often possible to interact with the first-stage bootloader (such as U-Boot) and with the command shell of the operating system that has been loaded. When combined with the ability to modify ROM contents or other ways to write/edit files in the device file system (such as downloading files over the network via FTP), this opens up the possibility of interactively debugging applications directly on the device. To use this method, you usually have to start by compiling the GDB server for the target architecture and OS.
To demonstrate this method, we will connect a debugger to the head unit of a multimedia system for one of the more popular car brands, which runs the QNX real-time operating system.
The QNX SDK includes a modified GDB debugger with its own remote debugging protocol that is incompatible with the standard GDB server. This is why the pdebug daemon must be run on the device instead of the GDB server, after first copying it from the SDK if it is not already present on the device. The daemon can communicate with the remote GDB debugger via TCP or a serial port, which means that at least one of these device communication methods must be available for debugging to be possible.
We added the pdebug daemon to the device file system by modifying the memory contents. Let’s run it:
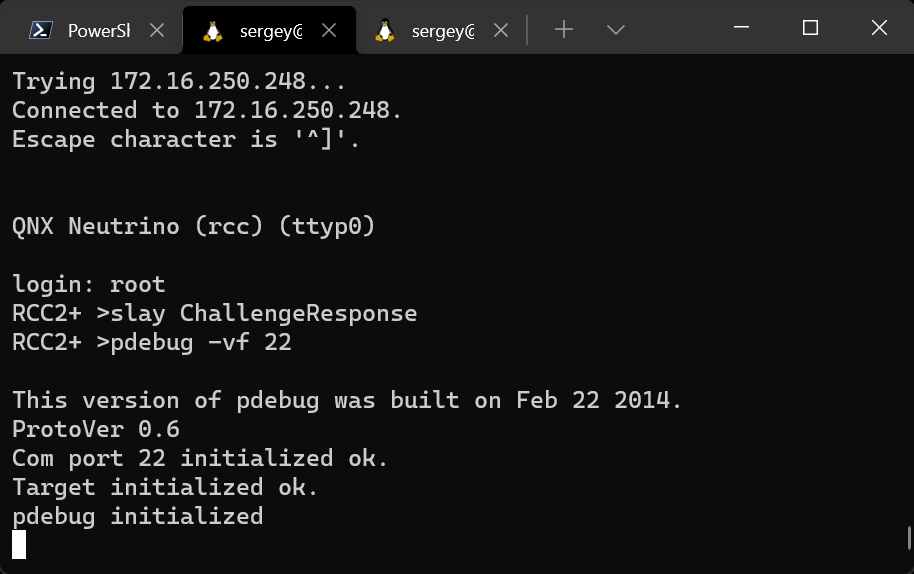
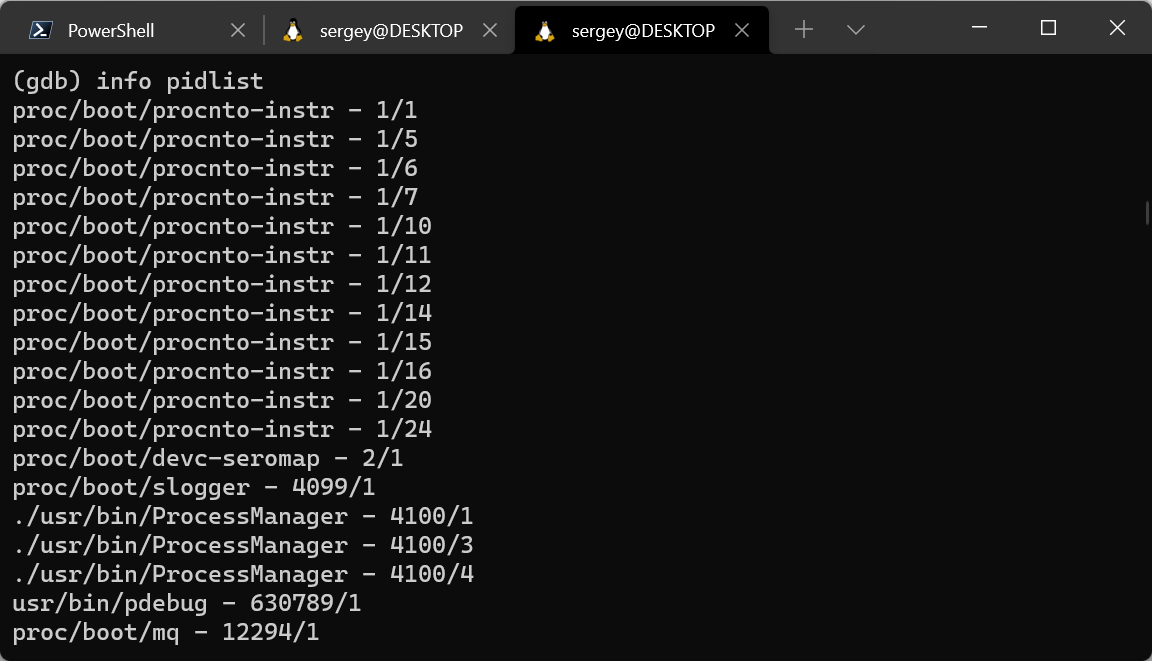
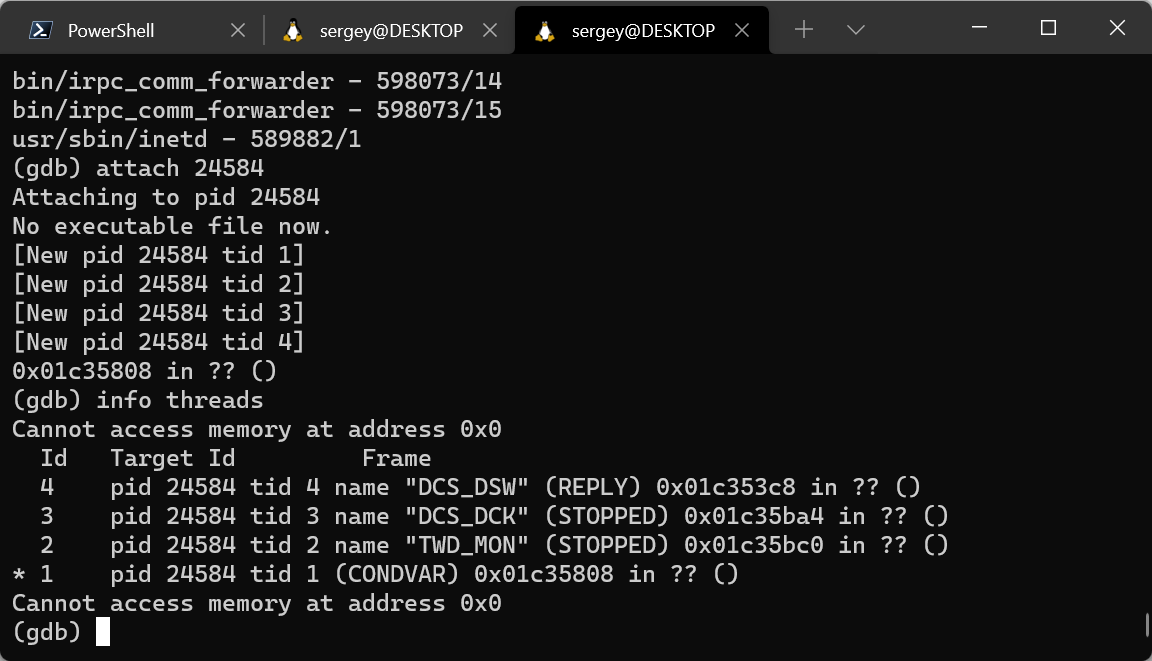
The port used for the connection is TCP port 22, which is the only port on the device being analyzed that is available for remote connections, while all other ports on the device are protected by the firewall. Now we can connect to the daemon using the GDB debugger that is included in the QNX Software Development Platform (SDK), and select a process to be debugged from the list of running processes or start a new process.
Please refer to official documentation for a concise guide on debugging with GDB in QNX.
In addition to using the device being analyzed for debugging, you can use other suitable devices. For example, the QNX 6.6 operating system used in this example can also be run on an easily accessible and affordable BeagleBone Black board. Although its hardware is different from that of the device being analyzed, you will most likely be able to analyze some of the applications from the firmware by simply copying pdebug to a partially compatible board and running it.
This could prove very useful, especially since modifying a device’s firmware to load the pdebug daemon into it, as demonstrated in this section, takes significant time and effort. Therefore, it may be less resource-intensive to just copy individual files from the firmware and run them on a compatible processor.
Conclusions on this tool
In the initial stages of research, it is usually difficult or even impossible to access various debugging interfaces of industrial devices. This means that it will most likely take some effort to ensure such access by activating disabled interfaces, soldering the missing electronic components onto the board, modifying the firmware, etc. However, after completing this intermediate task, debugging directly on the device may substantially simplify the rest of the research process.
Conclusion
Naturally, this article does not cover all of the diverse issues that the author encounters when researching device firmware. Nonetheless, it attempts to cover those issues which are most frequently encountered in the initial stages of research, and discusses problems that the author believes are potential stumbling blocks for the inexperienced researcher.
The author hopes that this overview of tools will make the work of beginning researchers easier and will accelerate their immersion into the subject matter of device firmware dynamic analysis.
The author also hopes that this overview will encourage the more experienced researchers to contribute to further development of the tools and frameworks described in this article.
If you would like more information, or feel like sharing your thoughts, please send a message to the author or to ics-cert@kaspersky.com.