18 September 2025
Threat landscape for industrial automation systems. Africa, Q2 2025
Africa
Key cybersecurity issues in the region
Low cybersecurity maturity of industrial companies
High threat detection rates point to low cybersecurity maturity across industrial companies on the continent: the availability of internet access on OT computers, weak phishing protection, large portions of unprotected infrastructure, and still relatively poor employee cyberhygiene.
In Africa, the percentage of ICS computers on which all categories of threats were blocked is higher than the global average.
Unprotected OT infrastructure and weak network segmentation
In Africa, the percentage of ICS computers on which self-propagating malware (worms and viruses) was blocked is significantly higher than the global average. By the percentage of ICS computers on which worms were blocked, Africa leads all other regions by a wide margin; in terms of viruses, it ranks second.
High detection rates of self-propagating malware and malware spread via network folders at the industry, country, or regional level likely indicate unprotected OT infrastructures lacking even basic endpoint protection. Such unprotected computers become sources of further malware spread.
Weak enterprise network segmentation and lack of control over removable media further exacerbate the situation.
Absence or ineffectiveness of perimeter defenses for OT networks
The rate of spyware detections in the region far exceeds the global average: it was 1.8 times higher in Q2 2025.
Finding spyware on ICS computers usually indicates that the initial infection vector — whether a malicious link, an attachment from a phishing email, or an infected USB device — has already succeeded. This points to the lack or ineffectiveness of OT network perimeter defenses, such as monitoring network communications and enforcing removable media usage policies.
By the percentage of ICS computers on which spyware was blocked, Africa consistently ranks first among all regions.
Lack of control over the use of removable media
In Q2 2025, the percentage of ICS computers on which threats from removable media were blocked was 4.8 times higher than the global average. In this indicator, Africa leads the world by a wide margin.
Frequent attempts to infect protected systems via USB drives may indicate:
- A low level of enterprise digitalization (lack of secure internal file storage and transfer systems)
- The existence of significant unprotected enterprise infrastructure acting as a source of USB infections
- A poor overall information security culture
Cybersecurity adoption lags behind the pace of rapidly developing industries
One broad conclusion we can draw from years of monitoring OT infrastructure exposure to threats is that the implementation of cybersecurity measures and tools almost always lags behind industry growth. When facilities are commissioned, cybersecurity is often an afterthought. Protections are insufficient, staff is poorly trained, and compliance with security policies is half-hearted.
This trend is clearly visible in statistics on African industries and infrastructure types (see below). Rapidly developing sectors include oil and gas, energy, manufacturing, and construction. Engineering is developing alongside these.
Statistics across all threats
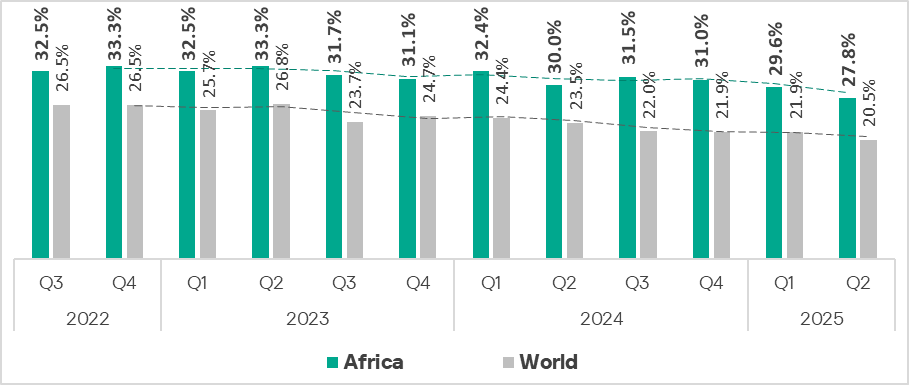
For many years, Africa has led the world by the percentage of ICS computers on which malicious objects were blocked. Compared to the global average, Africa’s figure in Q2 2025 was 1.4 times higher. Compared to Northern Europe, which ranks lowest, the figure was 2.5 times higher.
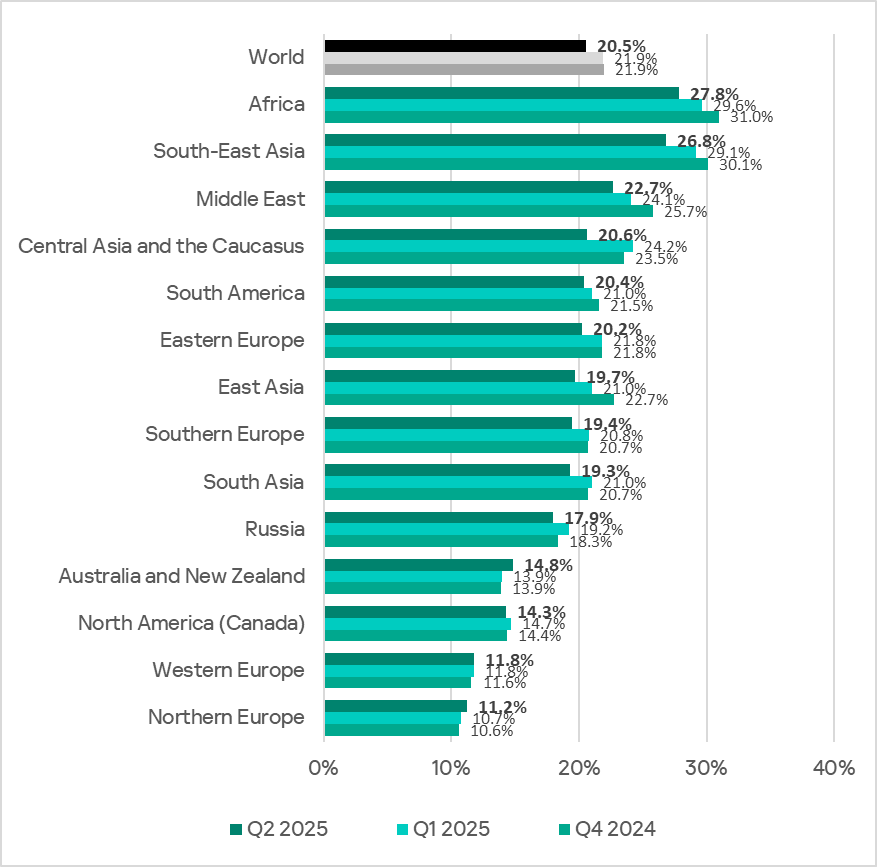
In Q2 2025, the percentage of ICS computers in Africa on which malicious objects were blocked dropped to 27.8%. This indicator has been declining in the region for three consecutive quarters.
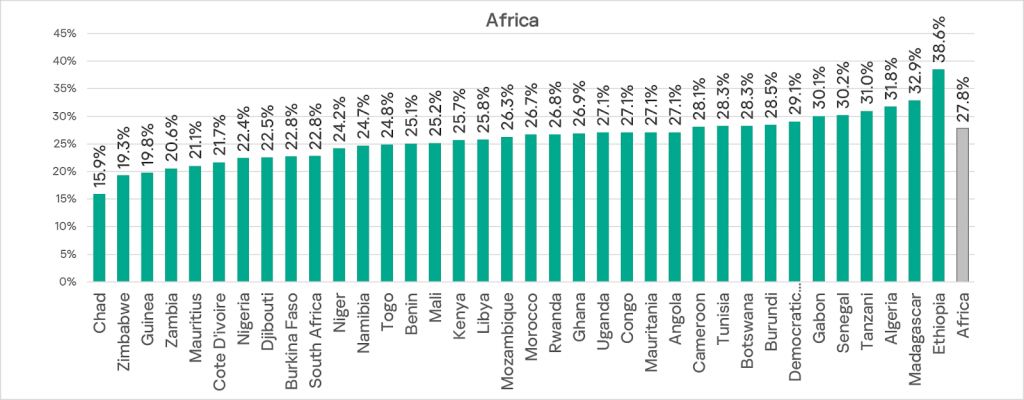
Across African countries, the percentage ranges from 15.9% in Chad to 38.6% in Ethiopia.
Only three countries are below 20%: Chad, Zimbabwe, and Guinea.
Two-thirds of countries in the region record rates above 25%. In Gabon, Senegal, Tanzania, Algeria, Madagascar, and Ethiopia, the figure exceeds 30%.
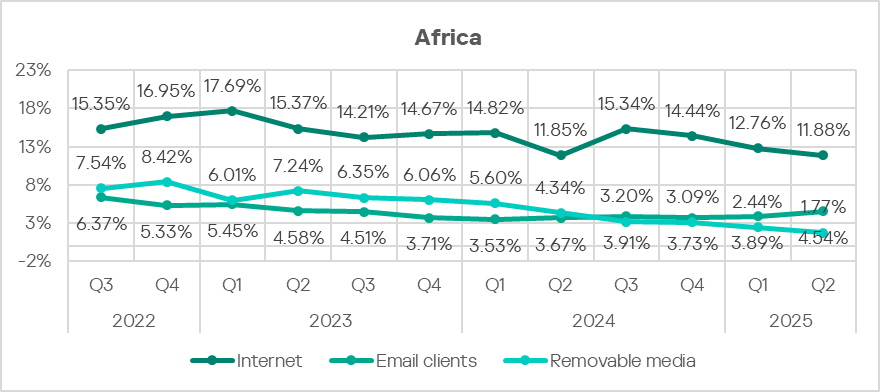
Threat sources
The indicators for all threat sources in the region exceed the global average. In the case of removable media, this excess is particularly significant at 4.8 times.
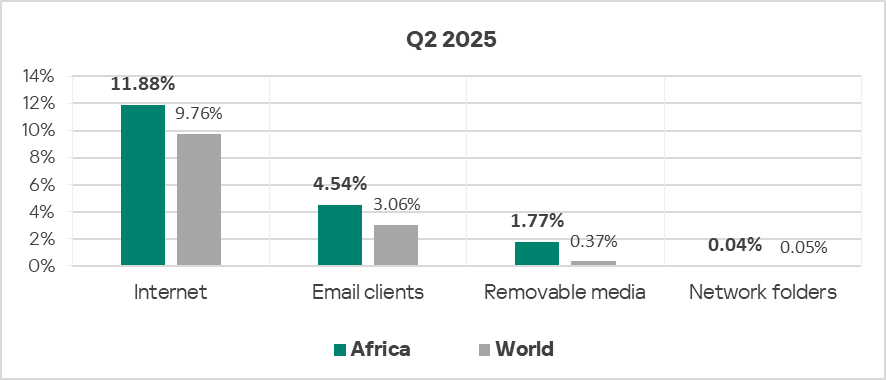
Of all threat sources, only email clients show a rising trend.
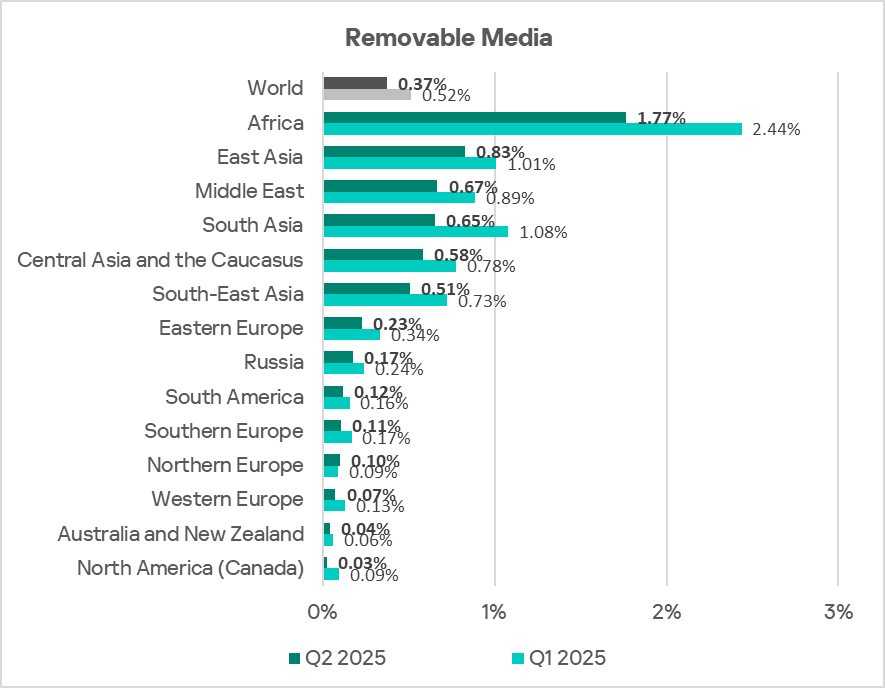
Removable media
Despite a clear trend toward a reduction in the percentage of ICS computers on which threats from removable media were blocked, Africa consistently leads the world by a large margin in this indicator. Africa’s figure is 66 times higher than that of North America (Canada), which has the lowest rate.
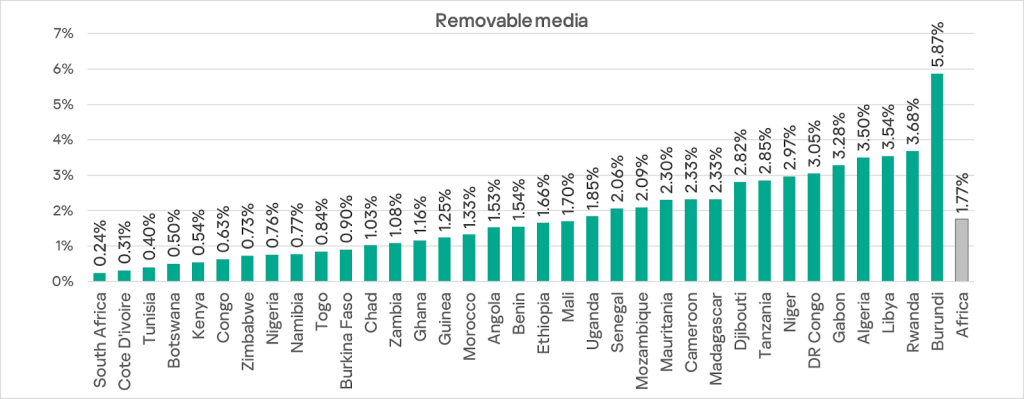
Among the countries in the region, Burundi leads by a wide margin in the percentage of ICS computers on which threats from removable media were blocked, with 5.8%. The figures for other countries range from 0.24% in South Africa to 3.68% in Rwanda.
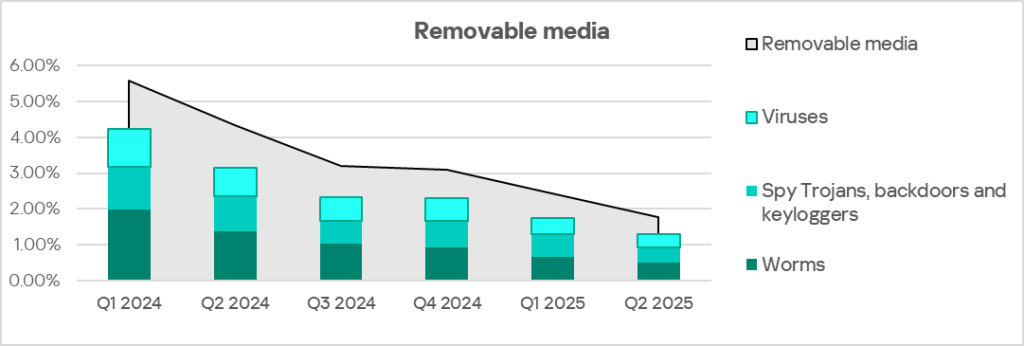
The main categories of removable media threats blocked on ICS computers in the region are worms, viruses, and spyware. Africa also leads the world in these categories (in viruses, it ranks second).
Internet
Another threat source where Africa leads is the internet. For this source, the situation is less dramatic: Africa’s figure exceeds that of East Asia, which ranks last, by only 1.9 times.
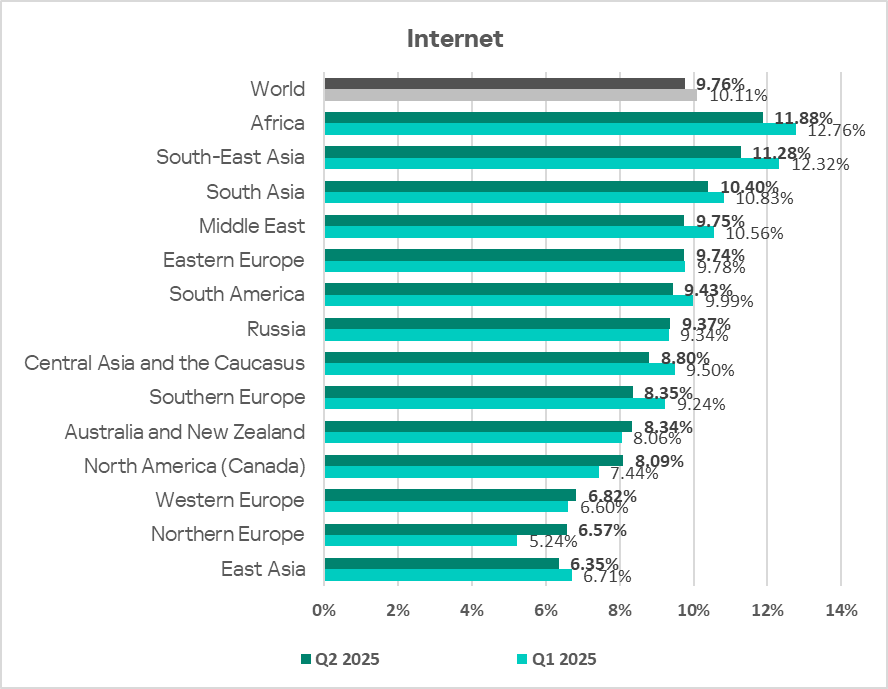
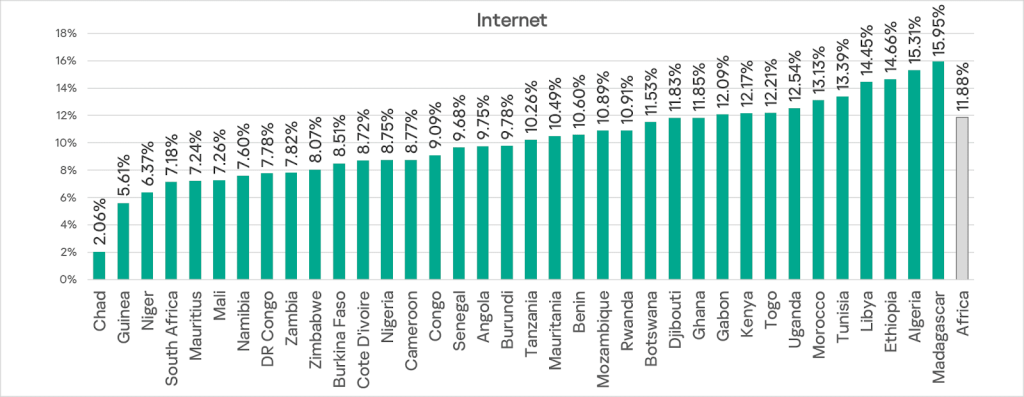
There is no clearly dominant country in the region for this indicator; however, Chad has a noticeably smaller percentage of ICS computers on which threats from the internet blocked (2.06%). Madagascar has the highest figure, 15.95%.
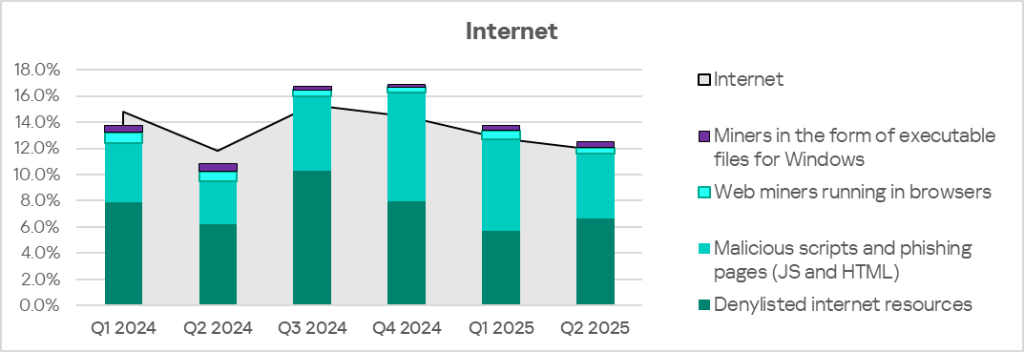
The main categories of internet threats blocked on ICS computers include denylisted internet resources, malicious scripts and phishing pages, and miners.
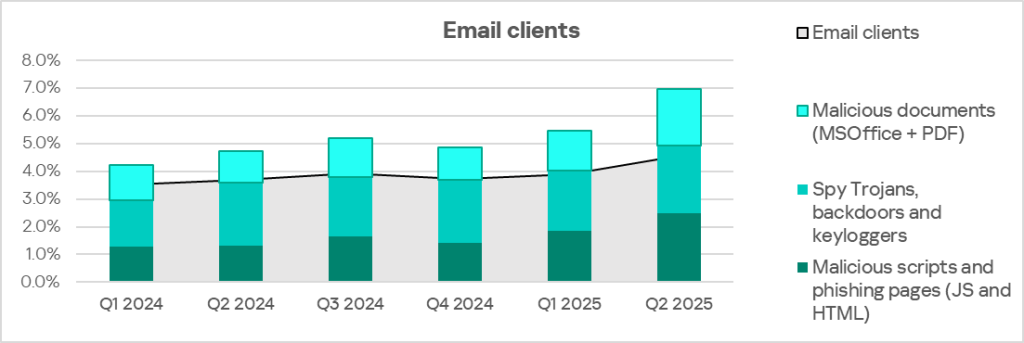
Email clients
Email clients are the only threat source in the region that has shown a rising trend for over a year. By percentage of ICS computers on which threats from email clients were blocked, Africa ranks fourth among the world’s regions at 4.54%. This is 5.7 times higher than in Russia, which has the lowest figure among regions.
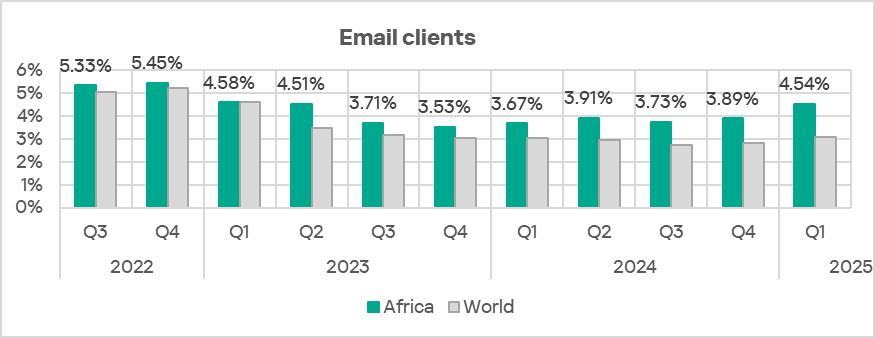
Within the region, South Africa and Namibia clearly lead in this indicator.
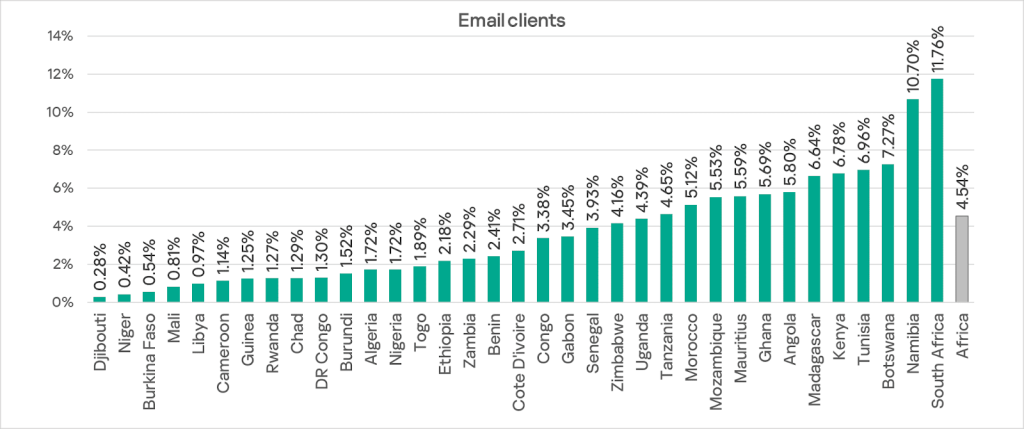
The main categories of email threats blocked on ICS computers are malicious documents, spyware, malicious scripts, and phishing pages.
Threat categories
In Africa, the percentage of ICS computers on which malicious objects were blocked exceeds the global average in every threat category. Africa leads the world in the following threat categories: denylisted internet resources, web miners, spyware, ransomware, and worms.
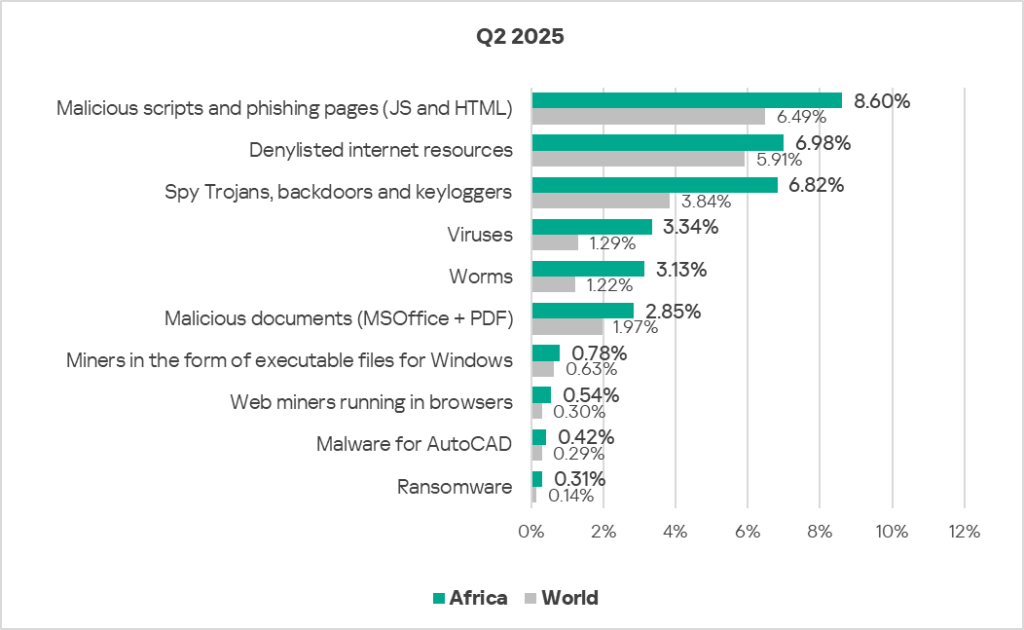
Self-propagating malware is the region’s worst problem: worm and virus rates each exceed the global average by 2.6 times.
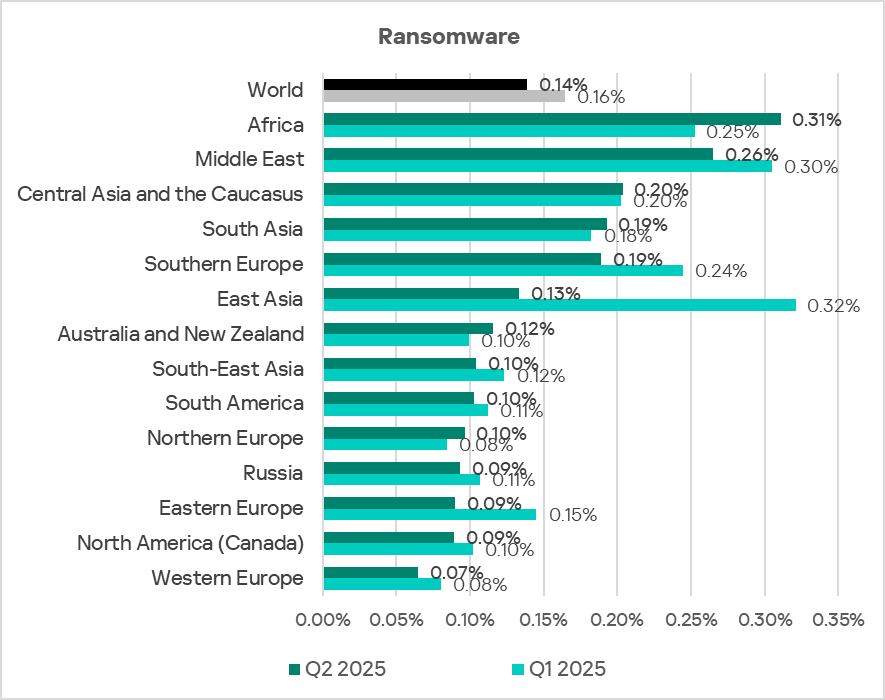
Ransomware indicators in Africa in Q2 are 2.2 times higher than the global average.
The region’s percentage of ICS computers on which spyware and web miners were blocked is 1.8 times higher than the global average.
In Q2 2025, Africa leads the rankings in the percentage of ICS computers on which the following were blocked:
- Denylisted internet resources
- Spyware
- Worms and viruses (second place for viruses)
- Web miners
- Ransomware
Self-propagating malware: worms and viruses
Worms and viruses are the main threat categories blocked when connecting removable media to ICS computers. Given Africa’s consistent top ranking for this threat source, it’s unsurprising that worms and viruses spread faster there than in other regions.
The worm rate, similar to the overall percentage of threats from removable media, is gradually decreasing. Virus dynamics are more complex, but we’ve also seen a decline here over the last two quarters.
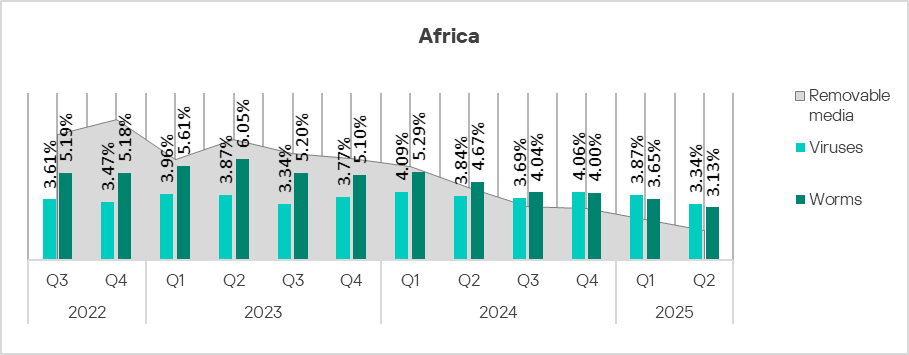
Despite the gradual decrease, these threats remain highly significant in Africa compared to other regions.
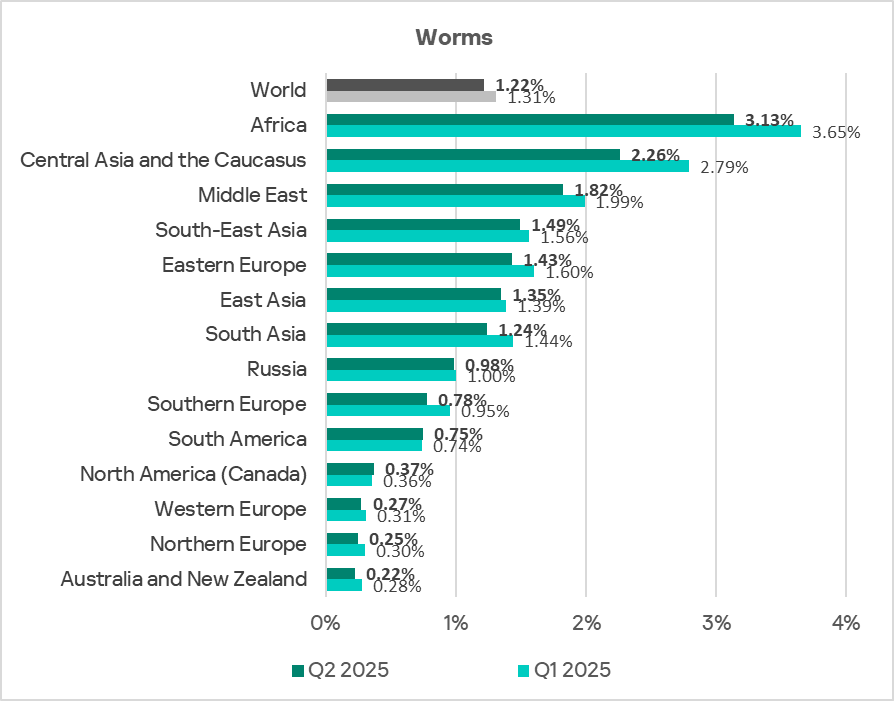
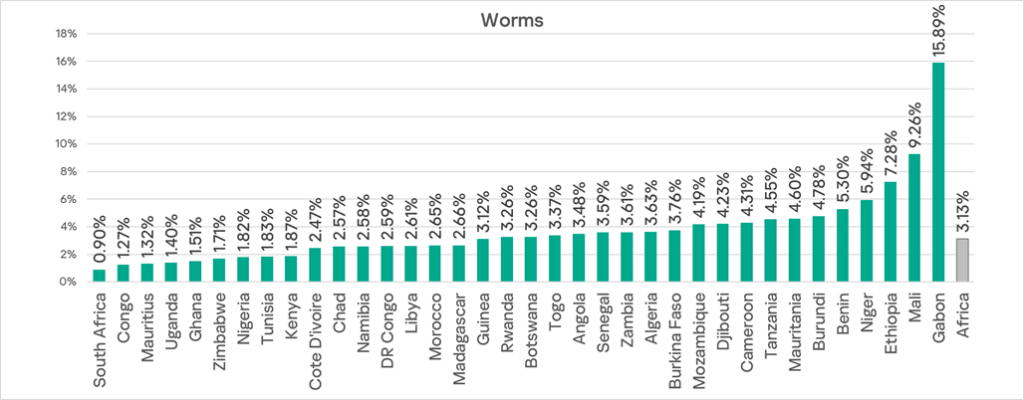
Worms
Africa has been a long-time leader among regions in the percentage of ICS computers on which worms were blocked. In Q2 2025, Africa’s figure (3.13%) is 14.2 times higher than that of Australia and New Zealand, which ranks last in this category.
Among the region’s countries Gabon leads this metric by a large margin with an anomalously high 15.89%. This is 1.7 times higher than the next country in the ranking, Mali (9.26%), and 17.7 times higher than South Africa (0.90%), which ranks last.
Viruses
Although Africa ranks second (3.34%) globally in the percentage of ICS computers on which viruses were blocked, its figure is 26 times higher than that of Australia and New Zealand, which ranks lowest.
Among the region’s countries, Mauritania, Cameroon, and Burundi lead in the percentage of ICS computers on which viruses were blocked, at 6.23%. As with worms, there is a wide range between countries: the highest figure (Mauritania at 8.95%) is 18.6 times higher than the lowest (South Africa, 0.48%).
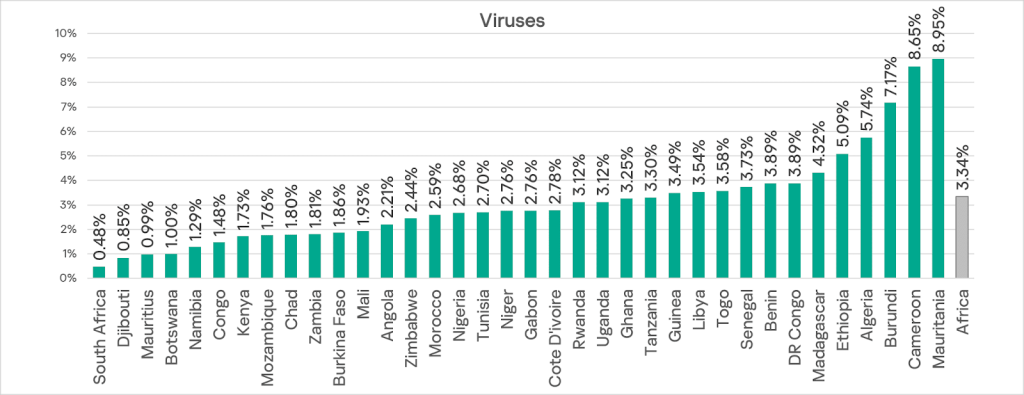
Notably, South Africa has the lowest rates of worms, viruses, and removable media threats, but leads in email client threats.
Spyware
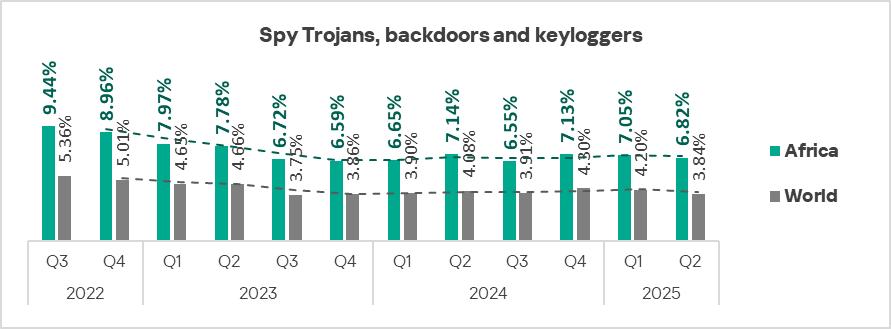
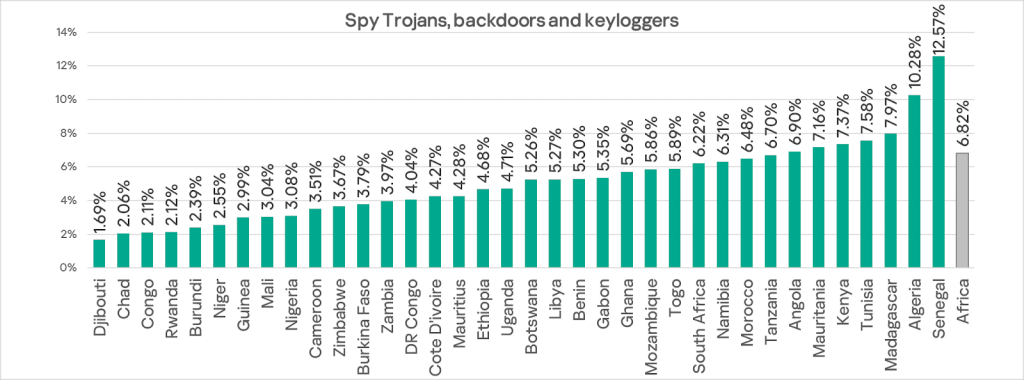
Another of the region’s persistent problems is spyware. Africa consistently leads regions in the percentage of ICS computers on which spyware was blocked. In Q2 2025, the figure in Africa decreased to 6.82%, but this is still 4.9 times higher than in Western Europe, which has the lowest rate.
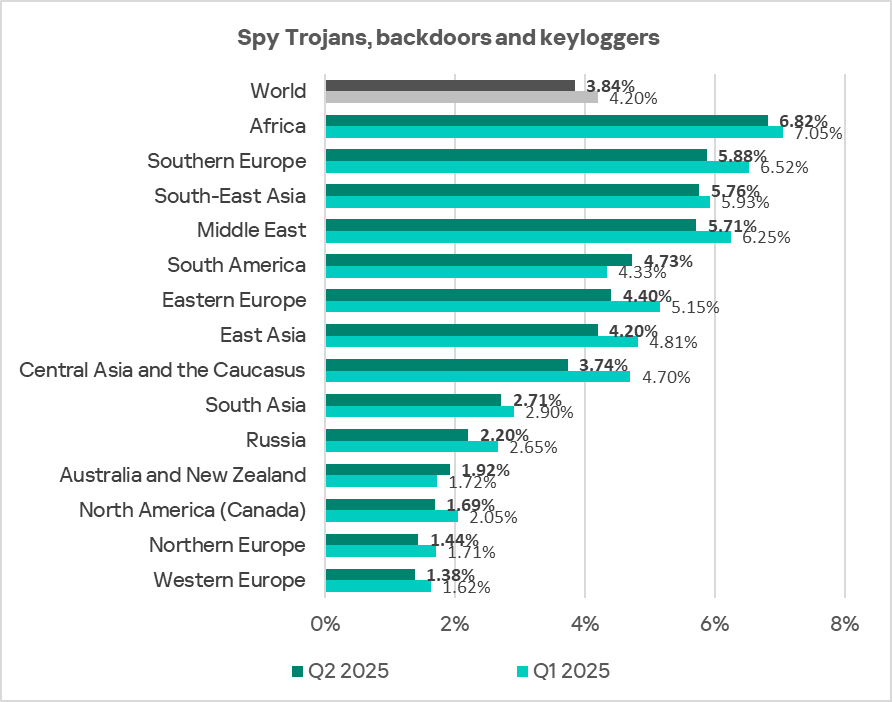
This figure for the region has fluctuated between 6.55% and 7.14% since Q1 2024.
Within the region, Senegal and Algeria lead in the percentage of ICS computers on which spyware was blocked.
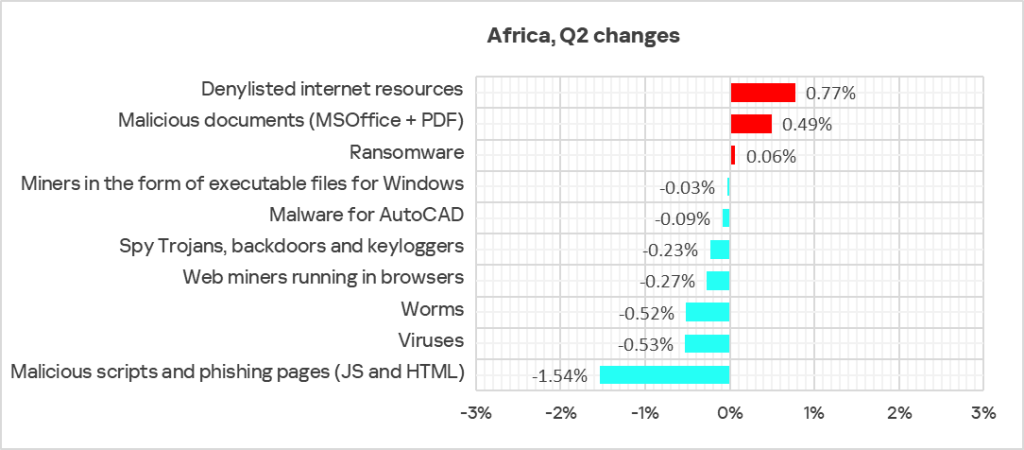
Q2 major threat: ransomware
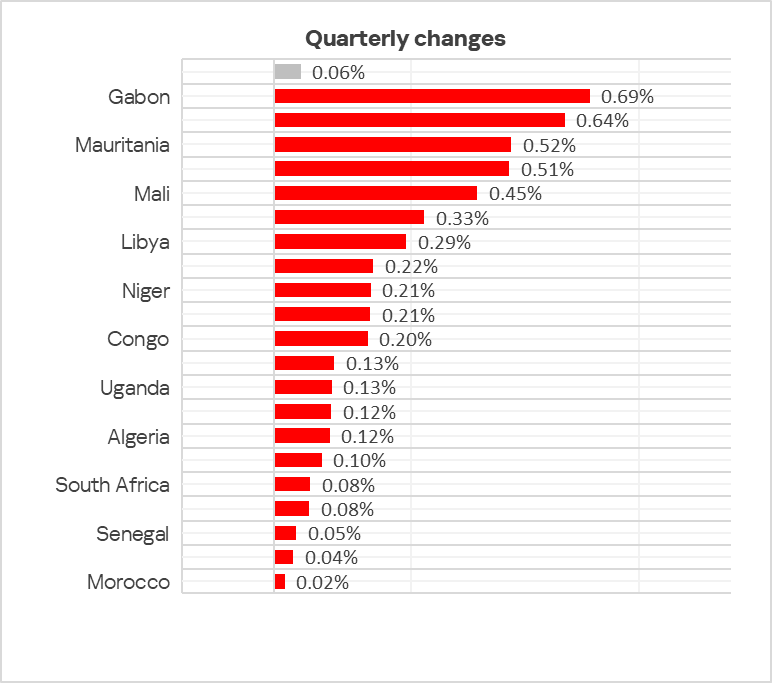
The percentage of ICS computers on which ransomware was blocked increased in Africa by 0.6% in Q2 2025. While this may seem small, it is significant for ransomware.
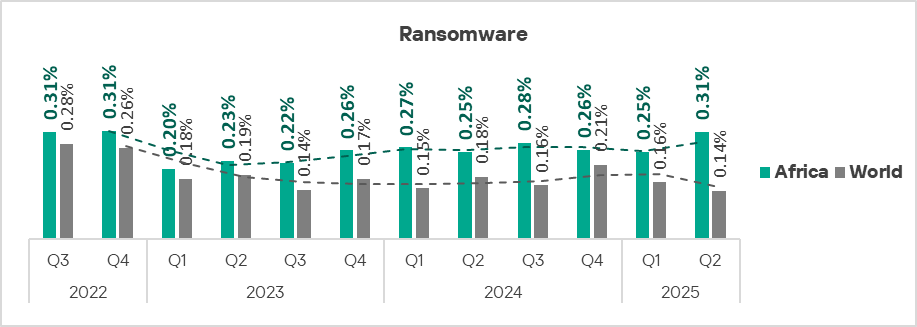
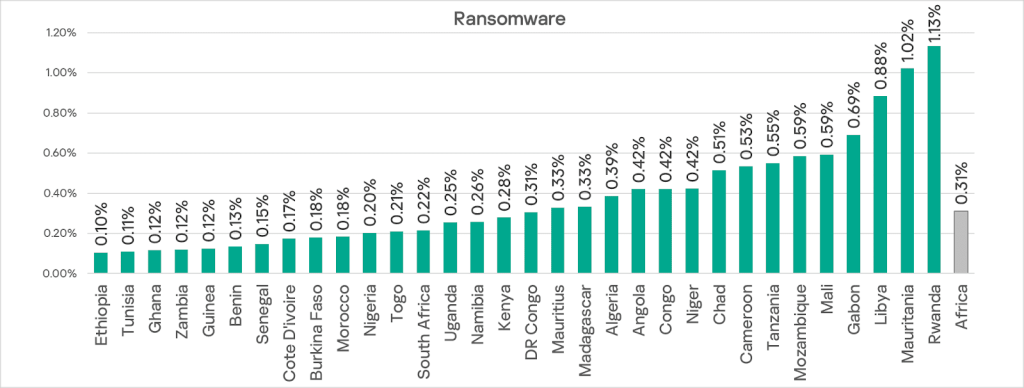
Africa ranks first among all regions in the increase of the percentage of ICS computers on which ransomware was blocked: 0.31% in Q2 2025. This is 4.8 times higher than the region with the lowest rate, Western Europe.
Within the region, the top three countries for this figure are Rwanda, Mauritania, and Libya. Gabon ranks fourth.
The percentage of ICS computers attacked by ransomware has risen most in Gabon and Rwanda, but in some countries of the region it didn’t increase at all. The chart below shows only countries with observed increases.
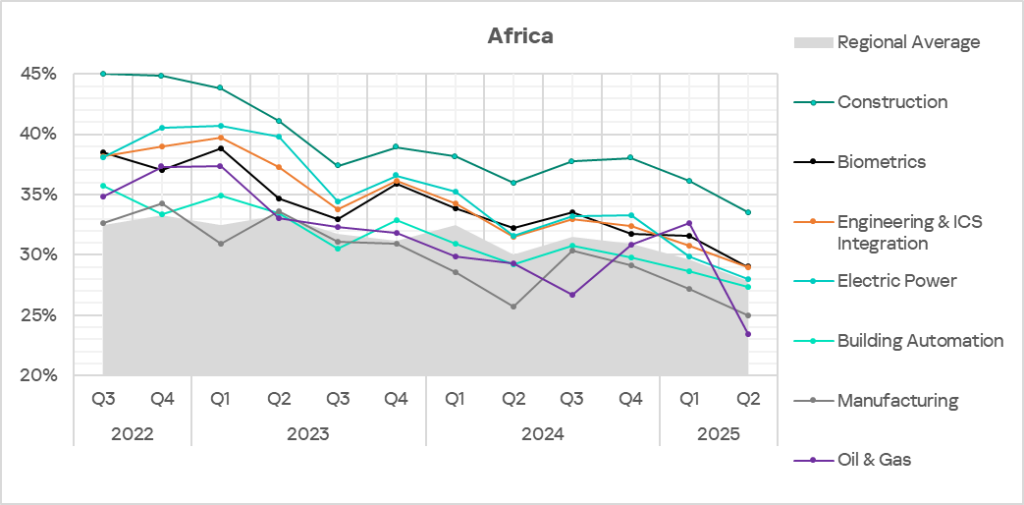
Industries
In Africa, construction remains the most frequently threatened industry among those covered in this report.
All the region’s industries exceed the respective global averages. The largest differences are in construction (1.6 times), and manufacturing and oil and gas (1.5 times each).
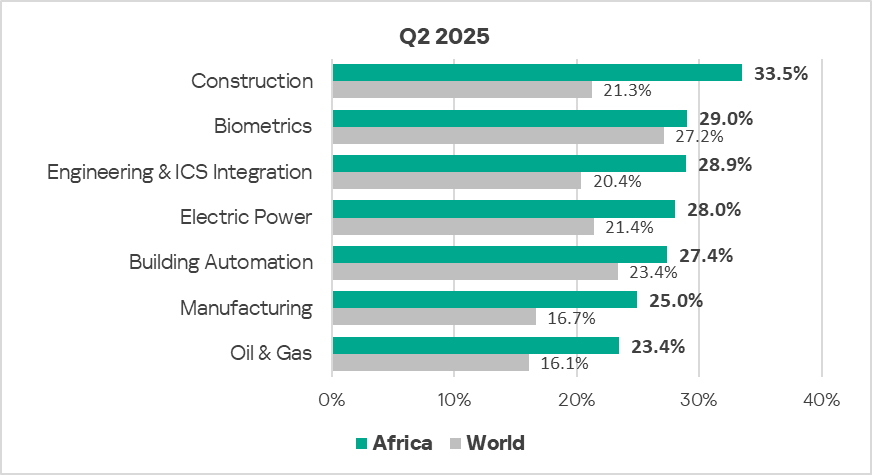
Africa leads the world in the percentage of attacked ICS computers in the following industries: construction, engineering and ICS integrators, and manufacturing.
All the industries covered show positive long-term trends (decreasing values) with significant periodic fluctuations.
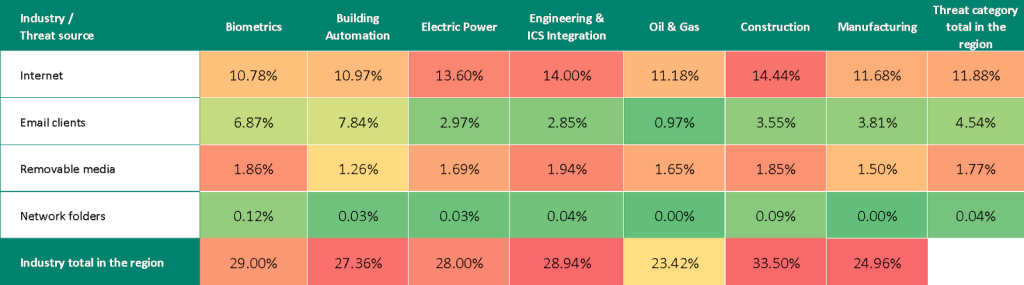
Threat sources and malware categories in industries: hot spots
We use heat maps to assess threats facing industries. On these maps, cells are colored from red to green, where red indicates the maximum value for an industry in the region, or a threat source or type among all regions and industries. In Africa, the maximum values are observed for cumulative indicators in several industries: manufacturing, construction, engineering, and ICS integrators.
The heatmaps highlight industry hot spots — malware sources or categories with values higher than expected given the regional ranking of the industry or threat.
Threat source indicators for industries in Africa, Q2 2025
Threat category indicators for industries in Africa, Q2 2025
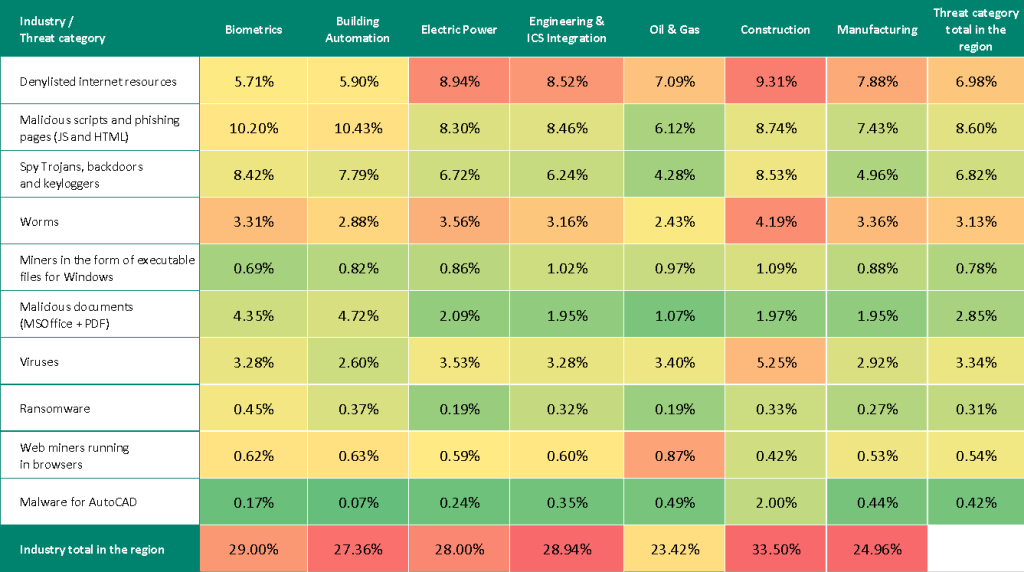
In all industries, the main source of threats is the internet. Consequently, relevant threat categories include malicious scripts, phishing pages, and dangerous links from denylists.
Industry hot spots
Construction
- Leader among industries in all regions in terms of internet threats. Ranks second in the region in terms of network folder threats. Third place in the region by the percentage of ICS computers on which threats from removable media were blocked.
- Second among industries across all regions in denylisted internet resources.
- Regional leader in multiple categories: denylisted internet resources, viruses, worms, spyware Trojans, malware for AutoCAD, and miners in the form of executable files for Windows.
Biometric systems
- Leader among industries in the region in threats from network folders. Second place in terms of email client and removable media threats.
- Regional leader in terms of ransomware threats.
- Second among industries in the region in terms of malicious scripts and phishing pages, and malicious documents.
Engineering and ICS integrators
- Leader among the region’s industries in the percentage of ICS computers on which threats from removable media were blocked. Second in the region in terms of internet threats, third in terms of network folder threats.
- Second in the region in terms of miners in the form of executable files for Windows.
- Third place in denylisted internet resources.
Electrical energy industry
- Third among the region’s industries in the percentage of ICS computers on which threats from the internet were blocked. Fourth in threats from removable media.
- Second place in the following threat categories: denylisted internet resources, worms, and viruses.
- Third in malicious documents.
- Fourth in the region in terms of spyware.
Building automation
- Leader among the region’s industries in terms of email client threats; fourth in terms of network folder threats.
- Leader in terms of the percentage of ICS computers on which malicious scripts, phishing pages, and malicious documents were blocked.
- Second place in ICS computers with blocked ransomware.
- Third in the region in terms of web miners.
Manufacturing
- Third among the region’s industries in terms of email client threats. Fourth in terms of internet threats.
- Ranks third in worms and malware for AutoCAD.
- Fourth in denylisted internet resources and miners in the form of executable files for Windows.
Oil and gas industry
- Leader among the region’s industries in terms of web miners.
- Second in the region in terms of malware for AutoCAD.
- Third in miners in the form of executable files for Windows, as well as viruses.
Methodology used to prepare statistics
This report presents the results of analyzing statistics obtained with the help of Kaspersky Security Network (KSN). The data was received from KSN users who consented to its anonymous sharing and processing for the purposes described in the KSN Agreement for the Kaspersky product installed on their computer.
The benefits of joining KSN for our customers include faster response to previously unknown threats and a general improvement in the quality of detection by their Kaspersky installation achieved by connecting to a cloud-based repository of malware data that is not transferable to the customer in its entirety by nature of its size and the amount of resources that it uses.
Data shared by the user contains only the data types and categories described in the appropriate KSN Agreement. This data helps to a significant extent in analyzing the threat landscape and serves as a prerequisite for detecting new threats including targeted attacks and APTs1.
Statistical data presented in the report was obtained from ICS computers that were protected with Kaspersky products and which Kaspersky ICS CERT categorized as enterprise OT infrastructure. This group includes Windows computers that serve one or several of the following purposes:
- Supervisory control and data acquisition (SCADA) servers
- Building automation servers
- Data storage (Historian) servers
- Data gateways (OPC)
- Stationary workstations of engineers and operators
- Mobile workstations of engineers and operators
- Human machine interface (HMI)
- Computers used to manage technological and building automation networks
- Computers of ICS/PLC programmers
Computers that share statistics with us belong to organizations from various industries. The most common are the chemical industry, metallurgy, ICS design and integration, oil and gas, energy, transport and logistics, the food industry, light industry, pharmaceuticals. This also includes systems from engineering and integration firms that work with enterprises in a variety of industries, as well as building management systems, physical security, and biometric data processing.
We consider a computer as attacked if a Kaspersky security solution blocked one or more threats on that computer during the period under review: a month, six months, or a year depending on the context as can be seen in the charts above. To calculate the percentage of machines whose malware infection was prevented, we take the ratio of the number of computers attacked during the period under review to the total number of computers in the selection from which we received anonymized information during the same period.
- We recommend that organizations subject to restrictions on sharing any data outside the corporate perimeter consider using Kaspersky Private Security Network. ↩︎