19 September 2025
Threat landscape for industrial automation systems. Australia and New Zealand, Q2 2025
Australia and New Zealand
Key cybersecurity issues in the region
The cybersecurity situation in Australia and New Zealand is among the most favorable across all regions. The region ranked 11th in Q2 2025 based on the percentage of ICS computers on which malicious objects were blocked.
At the same time, the region was in higher positions in the rankings for some threat sources and categories:
- threats from email clients — 7th place;
- malicious scripts and phishing pages — 6th place;
- ransomware — 7th place;
- malicious documents — 8th place.
Threat actors use malicious scripts to perform a broad range of tasks — from gathering information, tracking, and redirecting the user’s browser to a malicious web resource, to downloading various types of malware (such as spyware, cryptocurrency miners, or ransomware) into the user’s system or browser. They are distributed both via the internet and through spam emails.
Threat actors send malicious documents in phishing messages and use them in initial infection attacks. Malicious documents usually contain exploits, malicious macros, and malicious links.
In Q2 2025, Australia and New Zealand was one of the two regions where the percentage of ICS computers on which malicious scripts and phishing pages were blocked did not decrease.
It was also one of the two regions where the percentage figure for spyware increased during the quarter. Australia and New Zealand ranks second based on the quarter-over-quarter increase in the percentage of ICS computers on which ransomware was blocked. This percentage has been growing in the region for three consecutive quarters.
Relatively high percentage values for threats distributed via email clients (phishing) and malicious scripts may indicate that OT systems in the region are accessible to the more advanced categories of threat actors.
Country specifics
In New Zealand, the percentage of ICS computers on which internet threats were blocked was 1.3 times higher than in Australia. New Zealand also showed higher percentage values for the threat categories that spread via the internet.
In Australia, the percentage of ICS computers on which threats from email clients were blocked was 3.1 times higher than in New Zealand. Australia also showed higher percentage figures for the threat categories that are distributed primarily via email.
Statistics across all threats
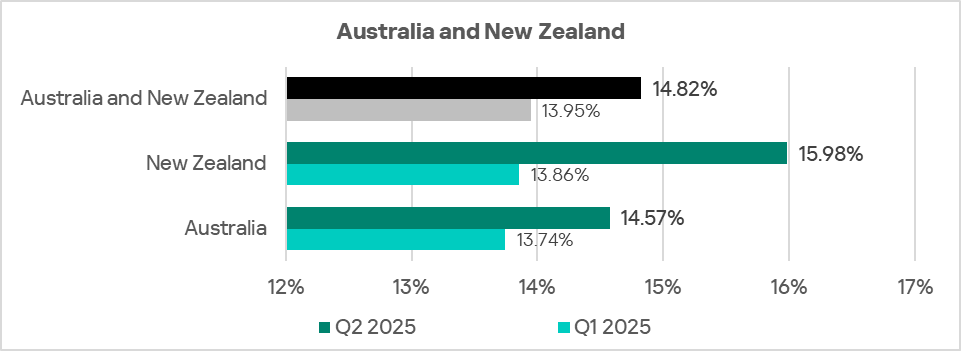
Australia and New Zealand ranks 11th among regions based on the percentage of ICS computers on which malicious objects were blocked. The value, 14.8%, is significantly below the global average, but it is 1.3 times higher than in Northern Europe, which ranks at the bottom.
Australia and New Zealand was one of only two regions where the percentage of ICS computers on which malicious objects were blocked increased in Q2 2025. The region ranks first in terms of the percentage increase.
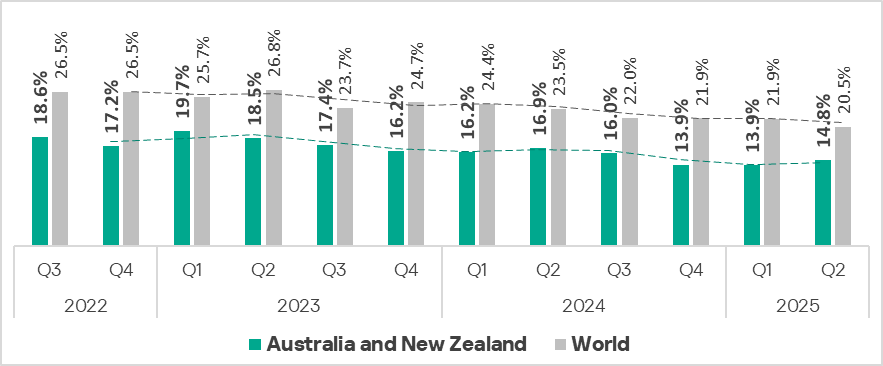
The region’s overall figure largely depends on the situation in Australia. The percentage of ICS computers on which malicious objects were blocked in Australia was lower than in New Zealand.
Threat sources
In Australia and New Zealand, percentage figures for all threat sources, except email clients, are lower than the global averages. The percentage of ICS computers on which threats from email clients were blocked in the region is 1.1 times higher than the global average.
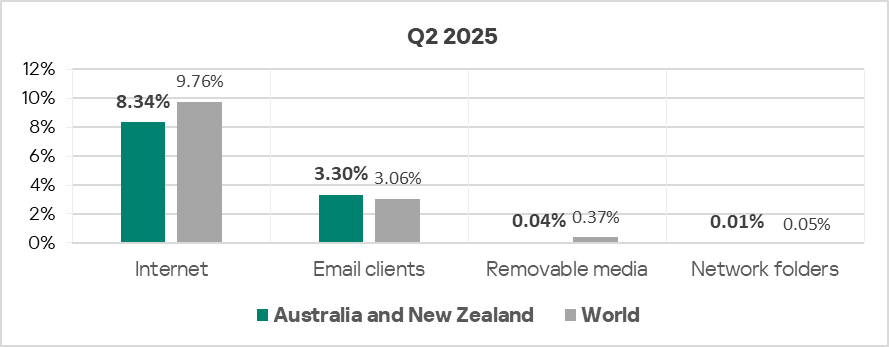
Malicious objects in the region are distributed primarily via the internet and email. Australia and New Zealand ranks second to last among all regions based on the percentage of ICS computers on which threats from removable media were blocked.
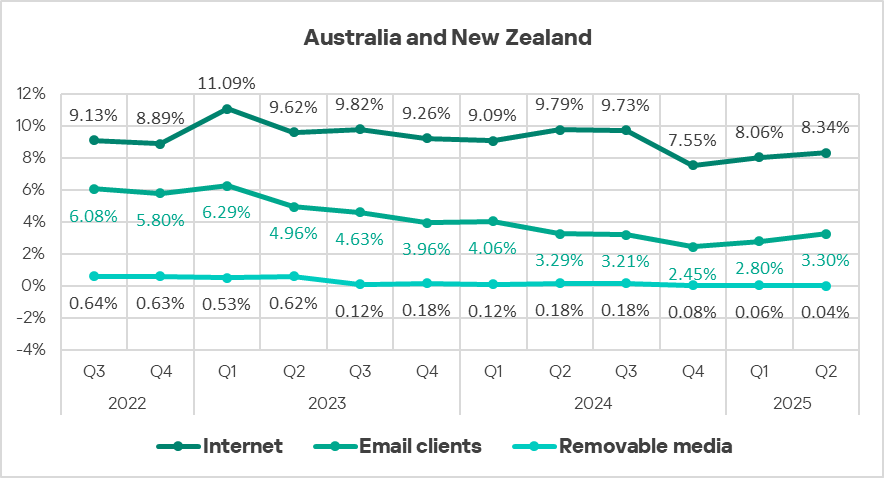
In Q2 2025, among all threat sources, the percentage of ICS computers on which malicious objects were blocked increased for the internet and email clients. Australia and New Zealand ranks second among regions based on the increase in the percentage value for internet threats.
Internet
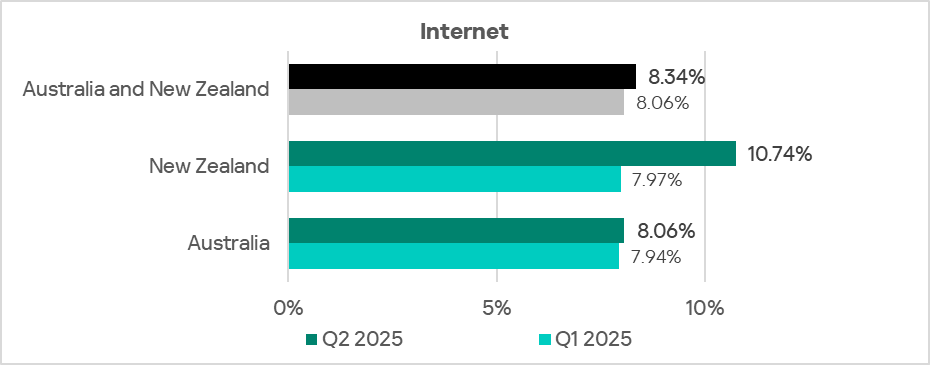
Australia and New Zealand ranks 10th, with 8.34%, based on the percentage of ICS computers on which internet threats were blocked. This is higher than the lowest regional figure, shown by East Asia, by a factor of 1.3.
After decreasing at the end of 2024, the percentage value in Australia and New Zealand has been growing for two consecutive quarters, although it remains below its pre-decline levels.
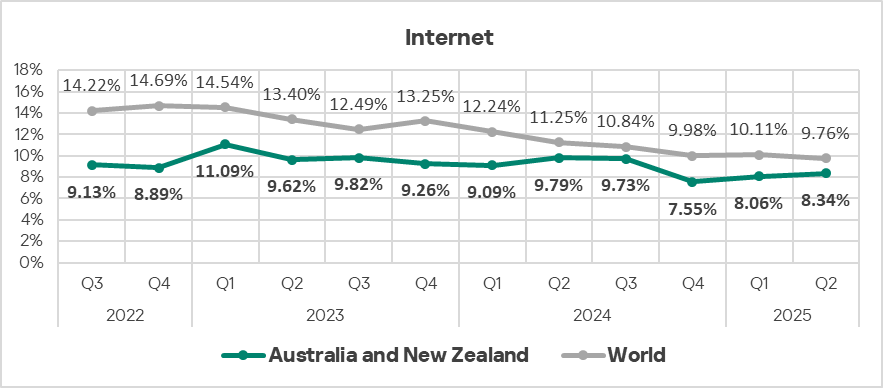
The percentage of ICS computers on which internet threats were blocked in New Zealand was 1.3 times higher than in Australia.
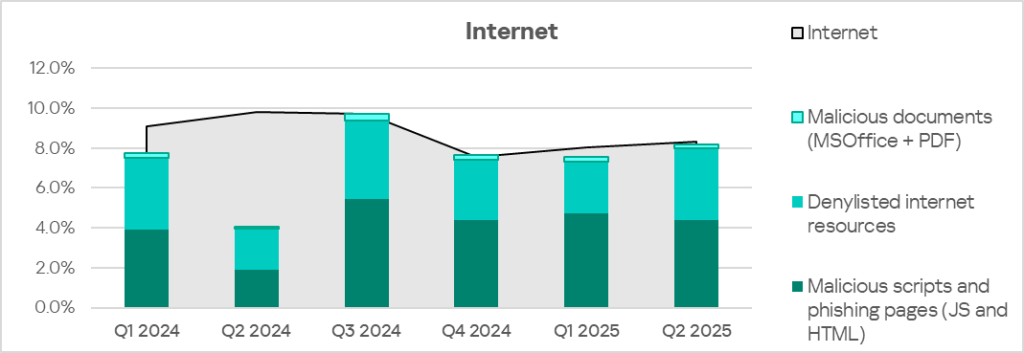
The main categories of internet threats blocked on ICS computers in the region include malicious scripts and phishing pages, as well as denylisted internet resources.
Email clients
In Q2 2025, Australia and New Zealand ranked 7th, with 3.30%, based on the percentage of ICS computers on which threats were blocked in email clients. This is 4.1 times higher than in Russia, which is in the last position in the ranking.
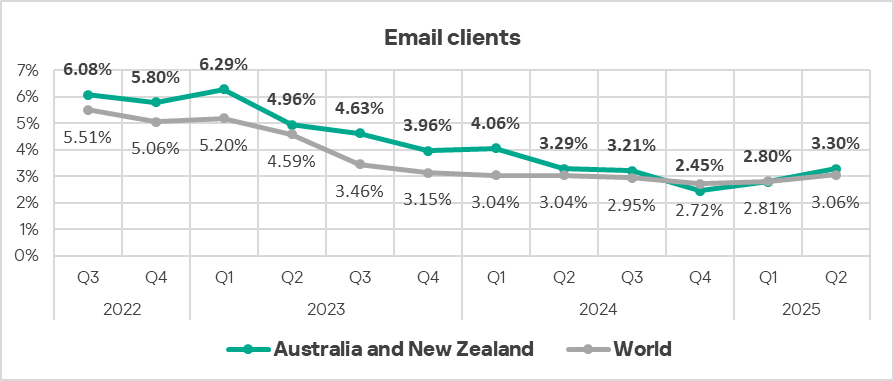
The percentage value in Australia was 3.1 times higher than in New Zealand.
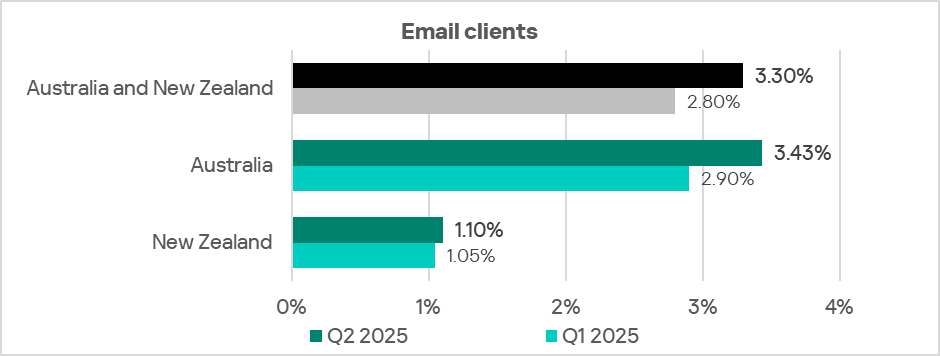
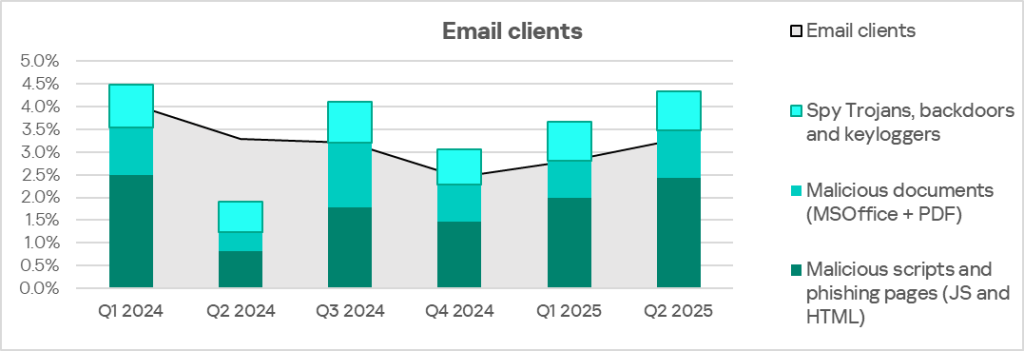
The main categories of email threats blocked on ICS computers in the region are malicious scripts and phishing pages, malicious documents, and spyware.
Threat categories
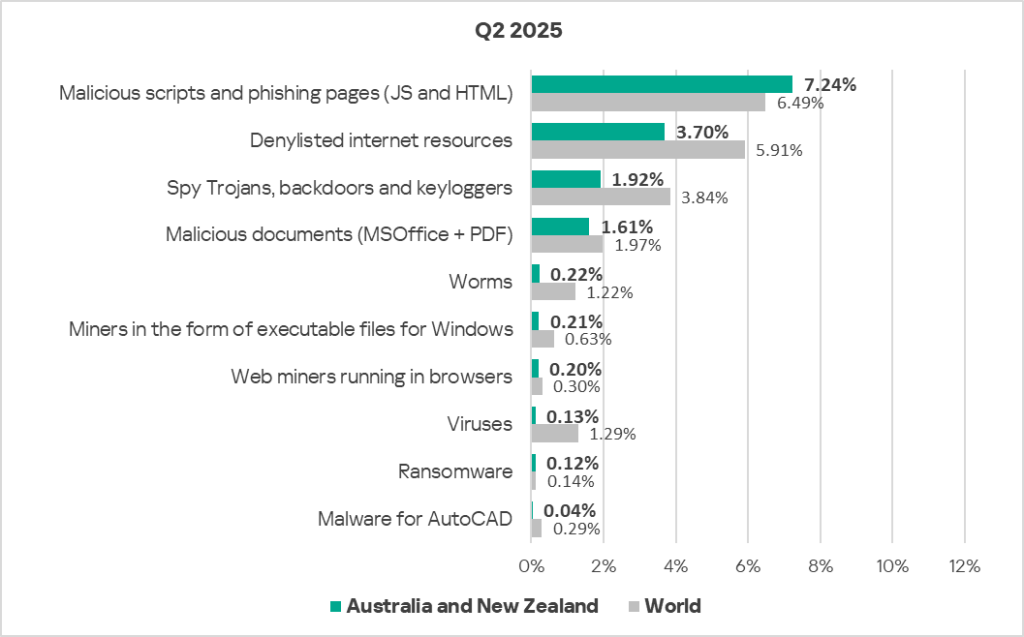
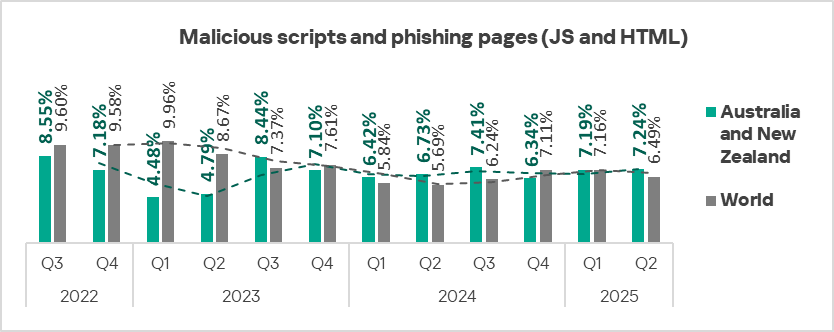
Among all threat categories, only the percentage of ICS computers on which malicious scripts and phishing pages were blocked in Australia and New Zealand exceeded the global average — by a factor of 1.1.
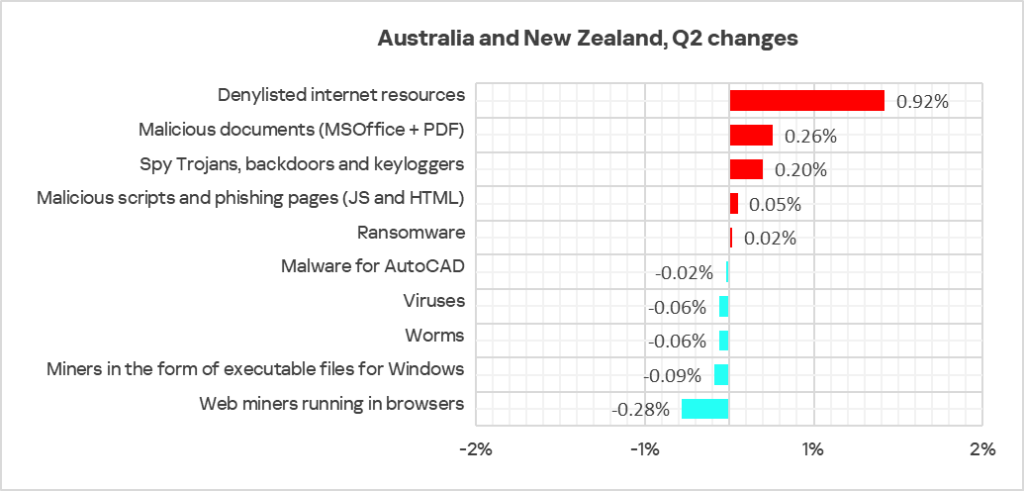
Quarter-over-quarter increases were recorded in the percentages of ICS computers on which the following categories of malicious objects were blocked:
- malicious scripts and phishing pages;
- denylisted internet resources — by a factor of 1.3;
- malicious documents — by a factor of 1.2;
- spyware — by a factor of 1.1;
- ransomware — by a factor of 1.2.
Malicious scripts and phishing pages
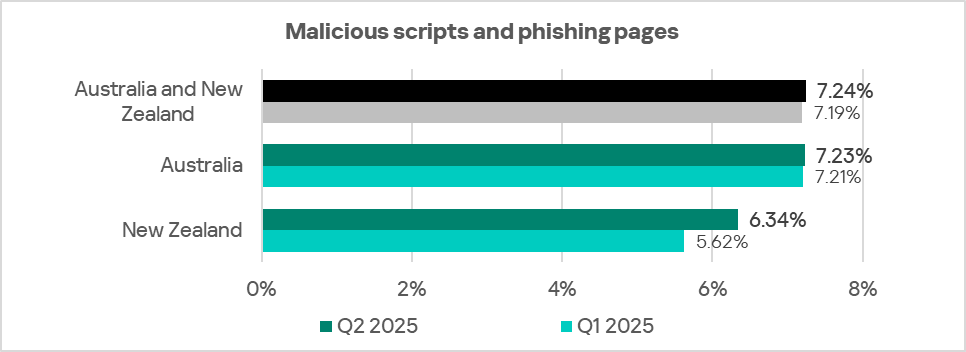
Australia and New Zealand ranks 6th based on the percentage of ICS computers on which malicious scripts and phishing pages were blocked, with 7.24%. This is 2.4 times higher than in Northern Europe, which has the lowest percentage figure among all regions.
In Q2 2025, the percentage of ICS computers on which malicious scripts and phishing pages were blocked decreased in all regions except Australia and New Zealand, as well as North America (Canada).
In Australia, the figure changed very little over the quarter; in New Zealand, it increased but remained below the value recorded in Australia.
Malicious scripts and phishing pages are distributed via both the internet and email.
Denylisted internet resources
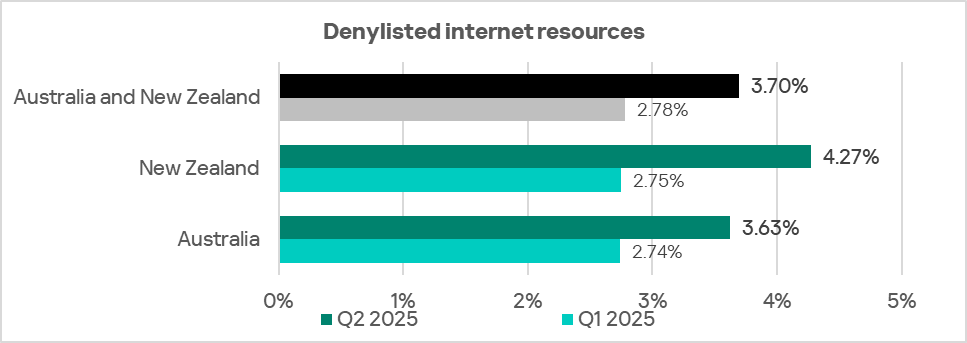
Australia and New Zealand ranks second to last, with 3.70%, based on the percentage of ICS computers on which denylisted internet resources were blocked. However, the region ranks 6th based on the growth in this parameter — the percentage value increased by a factor of 1.3 over the quarter.
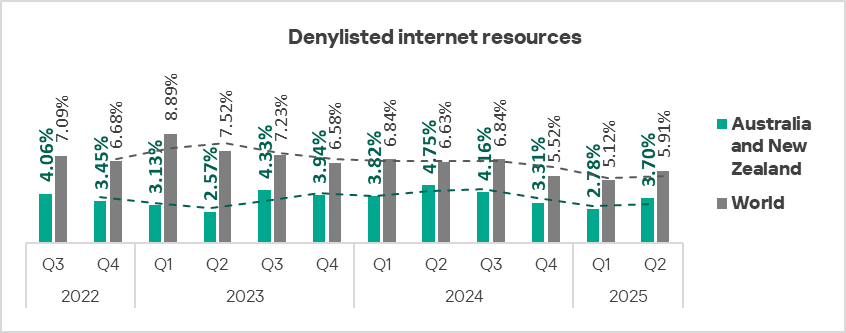
The percentage of ICS computers on which denylisted internet resources were blocked was 1.2 times higher in New Zealand than in Australia. Increases were recorded in both countries of the region.
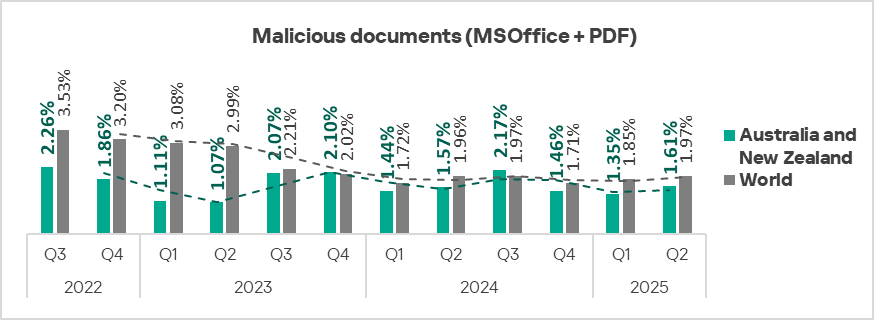
Malicious documents
Australia and New Zealand ranks 8th among regions based on the percentage of ICS computers on which malicious documents were blocked. The percentage figure in the region, 1.61%, is 2.5 times higher than in Northern Europe, which has the lowest ranking.
The percentage of ICS computers on which malicious documents were blocked fluctuated in the region.
The percentage figure in Australia was 1.7 times that in New Zealand.
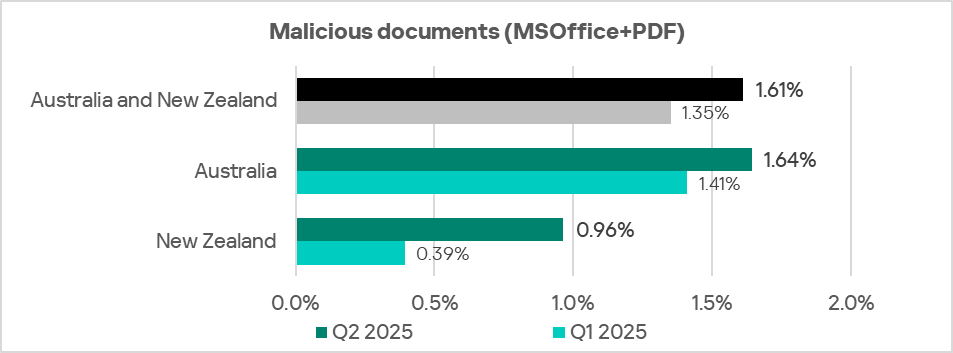
Malicious documents are primarily distributed via email.
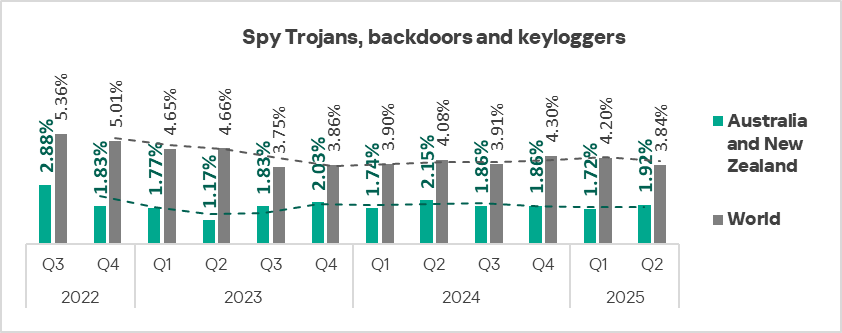
Spyware
Australia and New Zealand ranks 11th, with 1.92%, based on the percentage of ICS computers on which spyware was blocked. This is 1.4 times higher than in Western Europe, which has the lowest value.
The percentage of ICS computers on which spyware was blocked in the region fluctuates. Australia and New Zealand was one of the two regions where this figure increased in Q2 2025.
The percentage of ICS computers on which spyware was blocked was 1.3 times higher in New Zealand than in Australia.
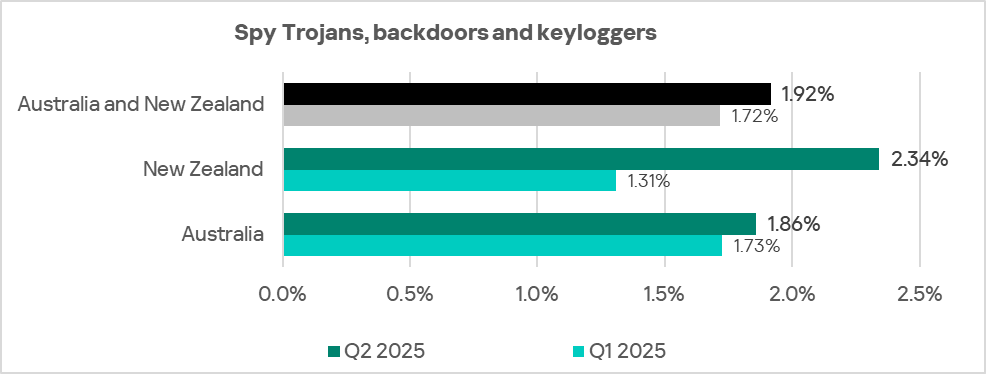
Spyware was blocked in the region across all threat sources, but mainly in email clients.
Ransomware
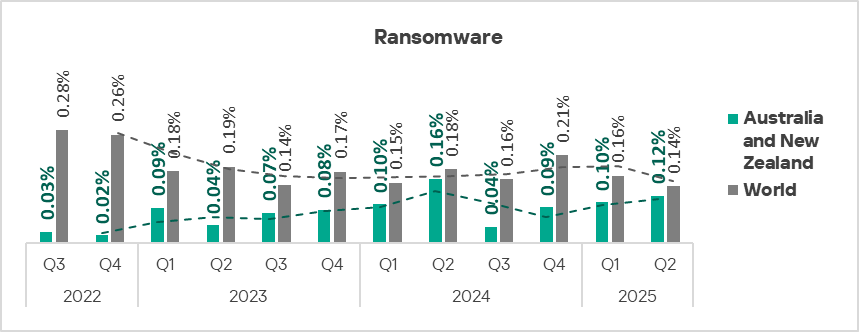
Australia and New Zealand ranks 7th, with 0.12%, based on the percentage of ICS computers on which ransomware was blocked. This is 1.8 times higher than in Western Europe, which ranks last in this category.
The region’s percentage figure has been growing for three consecutive quarters, and Australia and New Zealand ranks second globally based on the quarter-over-quarter increase in this figure in Q2 2025.
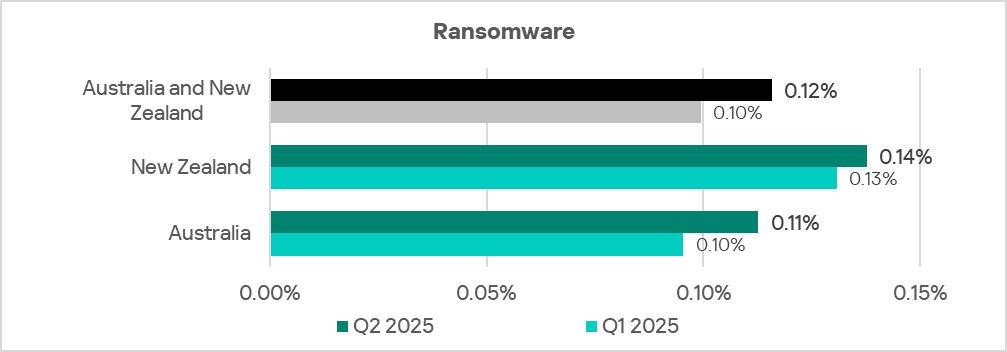
The percentage of ICS computers on which ransomware was blocked was 1.2 times higher in New Zealand than in Australia. Increases were recorded in both countries of the region.
Industries
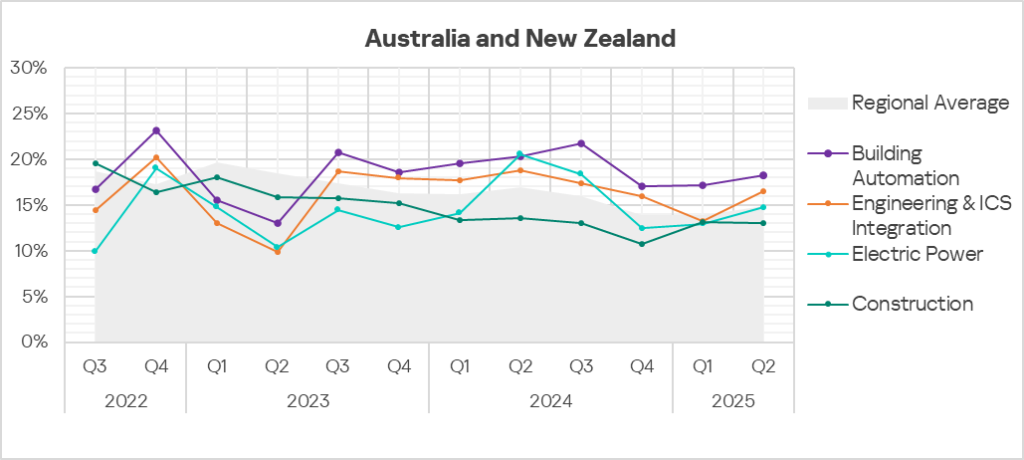
Among the industries reviewed for this report, building automation is the sector in Australia and New Zealand that encounters threats most often.
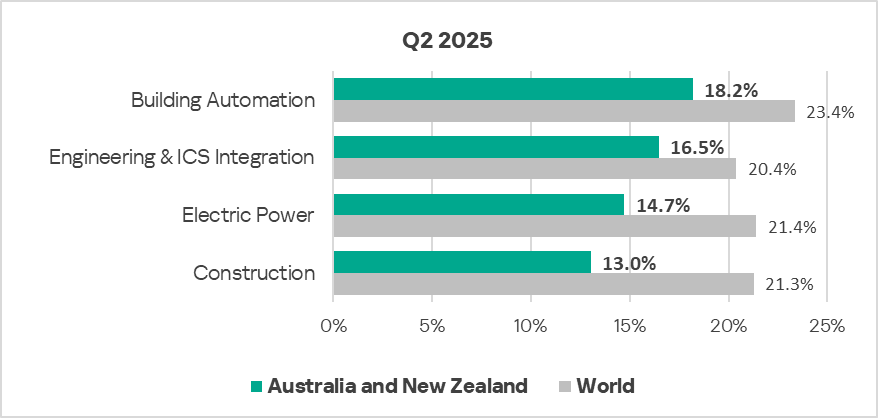
The percentage of ICS computers on which malicious objects were blocked in Q2 2025 increased in all industries reviewed, except construction.
The percentage figures for building automation, as well as engineering and ICS integrators, were above the regional average.
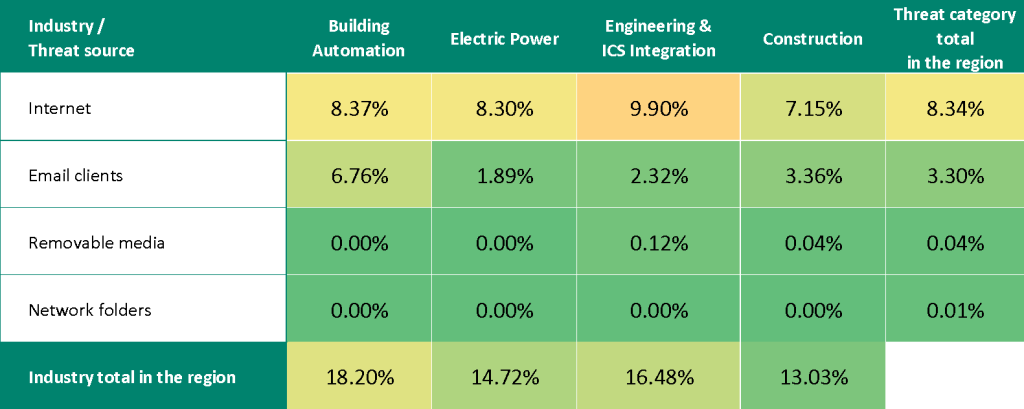
Threat sources and malware categories in industries: hot spots
We use heat maps as a tool for assessing industry-specific issues. On these maps, cells are colored in a gradient from red to green, where red indicates the maximum value for an industry in the region, or the maximum value for a threat source or threat category across all regions and industries. In Australia and New Zealand, values close to maximum are observed for internet threats in the engineering and ICS integrators sector.
Threat source indicators for industries in Australia and New Zealand, Q2 2025
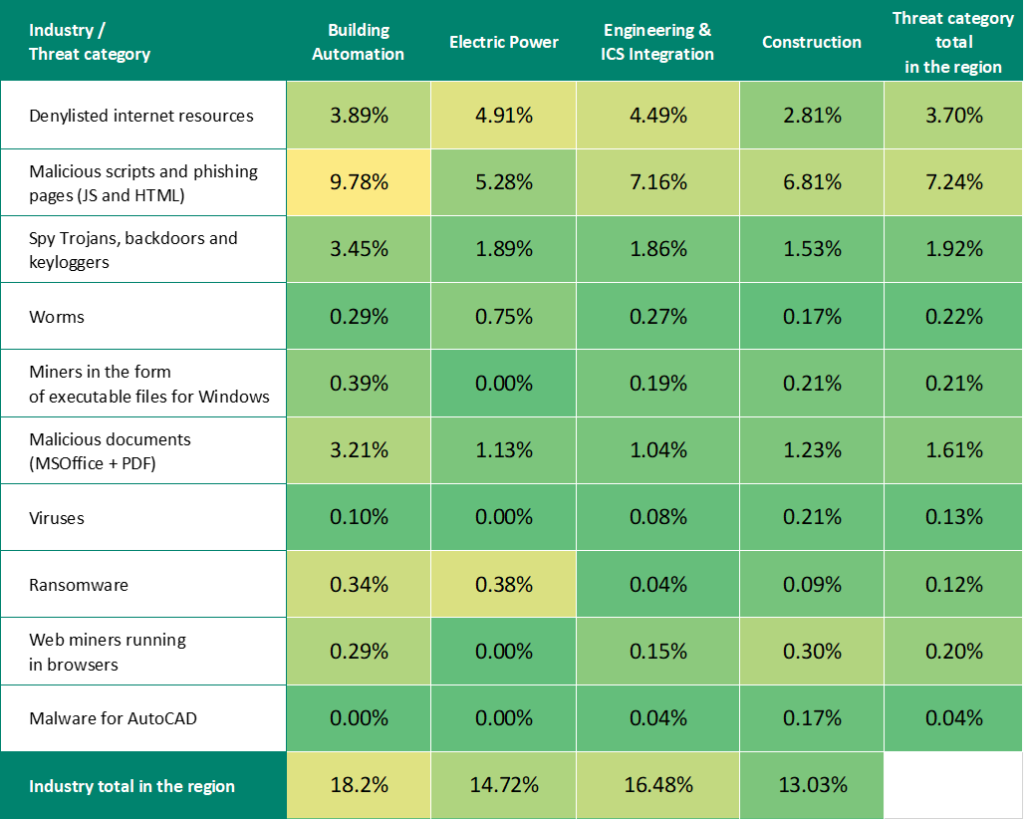
Threat category indicators for industries in Australia and New Zealand, Q2 2025
Industry hot spots
Building automation
- Ranks first among industries in the region based on the percentage of ICS computers on which threats were blocked in email clients. Second place in the region for internet threats.
- Ranks first among industries based on percentage values for the following threat categories: malicious scripts and phishing pages, spyware, malicious documents, and miners in the form of executable files for Windows.
- Ranks second in the region based on percentage values for the following threat categories: worms, viruses, web miners, and ransomware.
- Ranks 8th among industries across all regions based on the percentage value for threats in the malicious scripts and phishing pages category.
Engineering and ICS integrators
- Ranks first in the region among industries based on the percentage of ICS computers on which internet threats were blocked.
- Ranks second in the region among industries based on the percentage values for the following threat categories: malicious scripts and phishing pages, denylisted internet resources, and malware for AutoCAD.
Electric power
- Ranks first among industries in the region based on percentage values for the following threat categories: denylisted internet resources, worms, and ransomware.
- Ranks second among industries in the region based on the percentage value for spyware.
Construction
- Ranks second among industries in the region based on the percentage of ICS computers on which threats were blocked in email clients.
- Ranks first in the region based on percentage values for the following threat categories: web miners, viruses, and malware for AutoCAD.
- Ranks second in the region based on percentage values for malicious documents and miners in the form of executable files for Windows.
Methodology used to prepare statistics
This report presents the results of analyzing statistics obtained with the help of Kaspersky Security Network (KSN). The data was received from KSN users who consented to its anonymous sharing and processing for the purposes described in the KSN Agreement for the Kaspersky product installed on their computer.
The benefits of joining KSN for our customers include faster response to previously unknown threats and a general improvement in the quality of detection by their Kaspersky installation achieved by connecting to a cloud-based repository of malware data that is not transferable to the customer in its entirety by nature of its size and the amount of resources that it uses.
Data shared by the user contains only the data types and categories described in the appropriate KSN Agreement. This data helps to a significant extent in analyzing the threat landscape and serves as a prerequisite for detecting new threats including targeted attacks and APTs1.
Statistical data presented in the report was obtained from ICS computers that were protected with Kaspersky products and which Kaspersky ICS CERT categorized as enterprise OT infrastructure. This group includes Windows computers that serve one or several of the following purposes:
- Supervisory control and data acquisition (SCADA) servers
- Building automation servers
- Data storage (Historian) servers
- Data gateways (OPC)
- Stationary workstations of engineers and operators
- Mobile workstations of engineers and operators
- Human machine interface (HMI)
- Computers used to manage technological and building automation networks
- Computers of ICS/PLC programmers
Computers that share statistics with us belong to organizations from various industries. The most common are the chemical industry, metallurgy, ICS design and integration, oil and gas, energy, transport and logistics, the food industry, light industry, pharmaceuticals. This also includes systems from engineering and integration firms that work with enterprises in a variety of industries, as well as building management systems, physical security, and biometric data processing.
We consider a computer as attacked if a Kaspersky security solution blocked one or more threats on that computer during the period under review: a month, six months, or a year depending on the context as can be seen in the charts above. To calculate the percentage of machines whose malware infection was prevented, we take the ratio of the number of computers attacked during the period under review to the total number of computers in the selection from which we received anonymized information during the same period.
- We recommend that organizations subject to restrictions on sharing any data outside the corporate perimeter consider using Kaspersky Private Security Network. ↩︎