23 September 2025
Threat landscape for industrial automation systems. Russia, Q2 2025
Russia
Current threats
The main source of threats in Russia is the internet
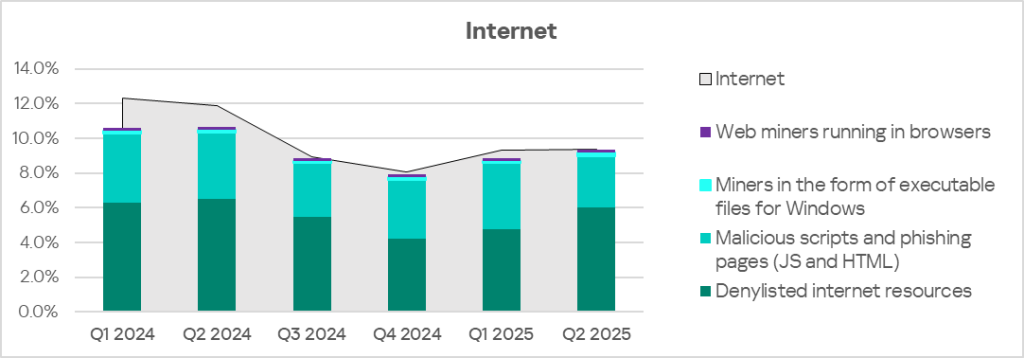
The main categories of internet threats blocked on ICS computers include denylisted internet resources, malicious scripts and phishing pages, and miners.
The list of denylisted internet resources is used to prevent initial infection attempts. In particular, the following threats on ICS computers are blocked with the aid of this list:
- Known malicious URLs and IP addresses used by attackers to host malicious payloads and configurations
- Suspicious (untrustworthy) web resources with entertaining or gaming content, often used to deliver unwanted software, cryptominers, and malicious scripts
- CDN nodes used by attackers to distribute malicious scripts on popular websites
- File and data sharing services, including repositories, often used by attackers to host payloads and next-stage configurations
Cybercriminals use denylisted internet resources primarily for malware distribution, for phishing attacks, and as command and control (C2) infrastructure. A significant percentage of these resources is used for spreading malicious scripts and phishing pages (HTML).
High values of the indicator typically point to:
- Weak control over the implementation of information security policies (ICS computers are internet-facing in some capacity)
- Failings in the information security culture (employees access unsafe internet resources)
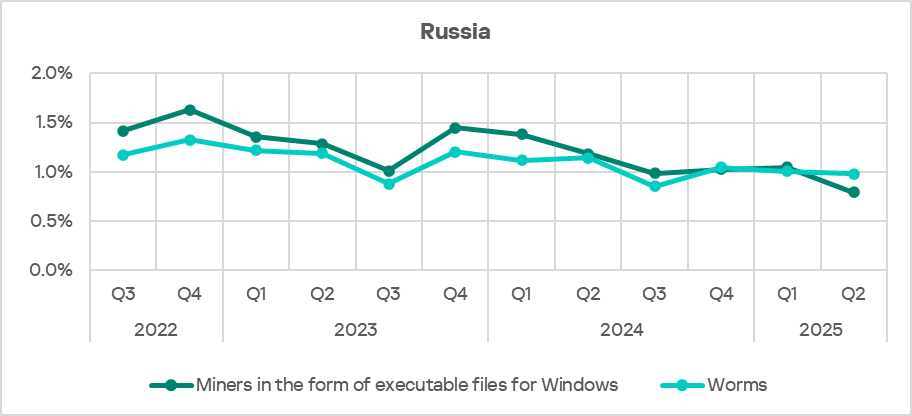
Miners in the form of executable files for Windows and worms
Since the end of 2022, Russia has consistently ranked second among regions (after Central Asia and the South Caucasus) by percentage of ICS computers on which miners in the form of executable files for Windows were blocked.
Worms in Q2 2025 climbed to fourth place in Russia in the ranking of threat categories. Besides Russia, only Central Asia and the South Caucasus region has such a high position for this threat category.
The dynamics of these two threat categories in Russia are strikingly similar. This is because miners for Windows actively use modules and components that are essentially worms and serve to deliver the miner to other computers in the network (automated lateral movement).
Statistics across all threats
Russia ranks 10th in the global ranking for percentage of ICS computers on which malicious objects were blocked.
In Q2 2025, this figure dropped by 1.3 pp to 17.9%.
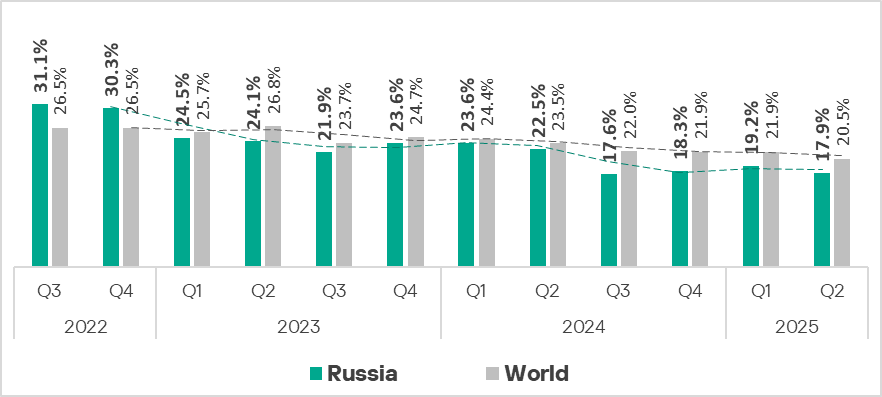
This indicator for the region has remained below the global average since the beginning of 2023. Compared to Northern Europe (the region with the lowest indicator), the percentage of attacked computers in Russia is 1.6 times higher.
Threat sources
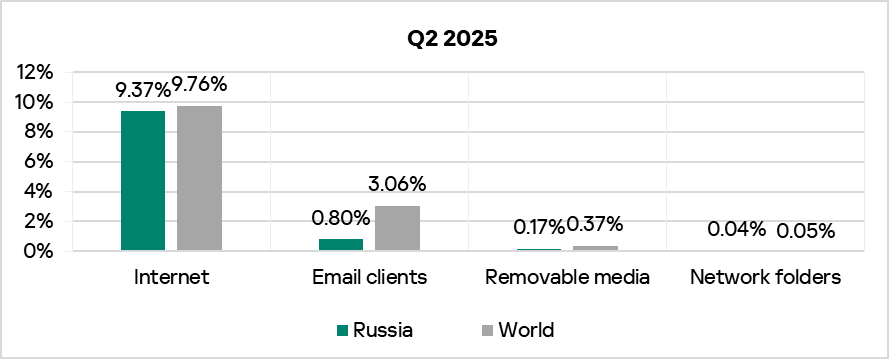
The percentages of ICS computers in Russia on which threats from various sources are blocked, are lower than the global average. The regional and global indicators are closest for internet threats.
Internet
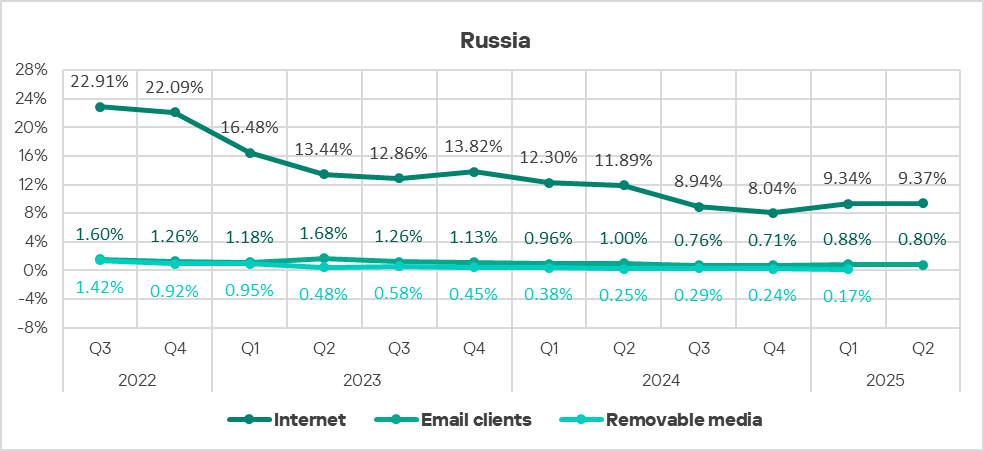
In the ranking of regions by percentage of ICS computers on which internet threats were blocked, Russia places seventh. Compared to the region that rounds off this ranking — East Asia — Russia scores 1.5 times higher.
The percentage of ICS computers on which internet threats were blocked has risen in Russia for two successive quarters. The indicators for other threat sources fell.
The main categories of internet threats blocked on ICS computers include denylisted internet resources, malicious scripts and phishing pages, and miners.
In terms of miners in the form of executable files for Windows, Russia ranks second among regions, and third in terms of web miners. The internet is the main distribution channel for these threats.
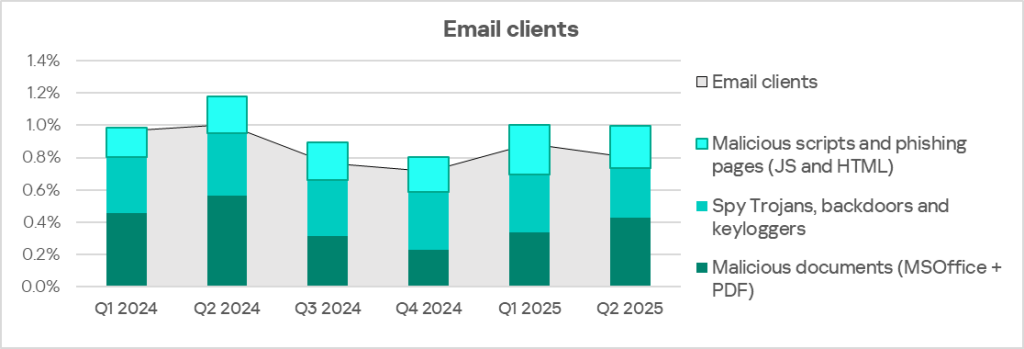
Email clients
The percentage of ICS computers on which email client threats were blocked in Q2 2025 was the lowest in Russia among all regions, 0.8%.
The main categories of email client threats blocked on ICS computers are malicious documents, spyware, malicious scripts, and phishing pages.
The main distribution channel for malicious documents and spyware is email.
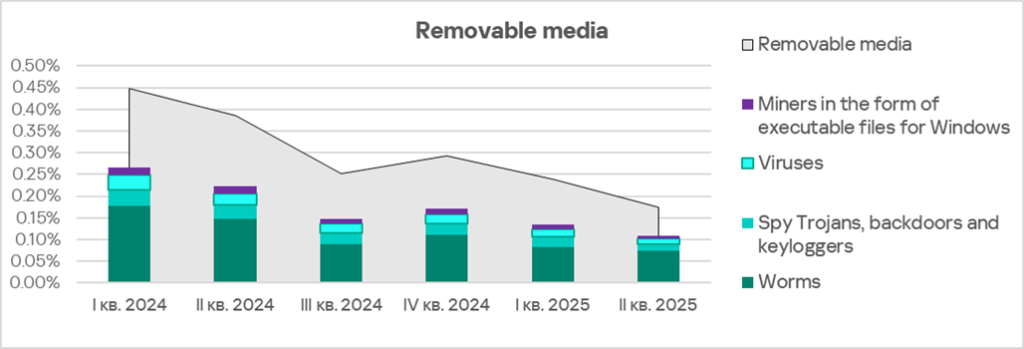
Removable media
By percentage of ICS computers on which removable media threats were blocked, Russia places eighth in the corresponding regional ranking with 0.17%. This figure is 6.5 times higher than in North America (Canada), which props up the ranking.
The main categories of removable media threats blocked on ICS computers in the region are worms, spyware, viruses, and miners in the form of executable files for Windows.
The main distribution channel for worms is removable media.
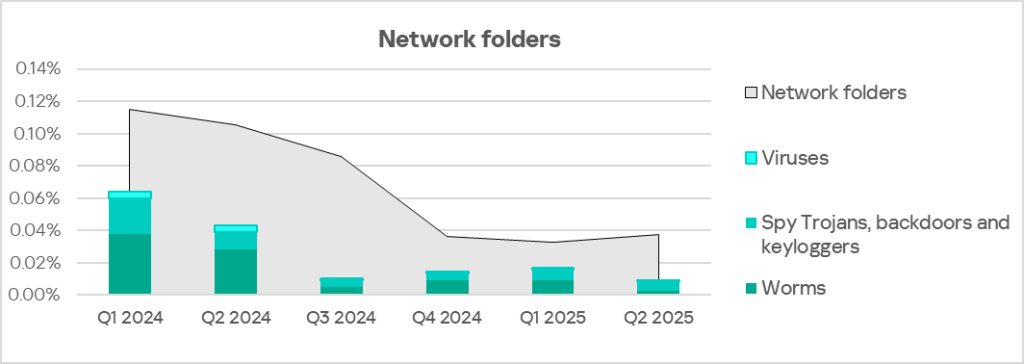
Network folders
By percentage of ICS computers on which network folder threats were blocked, Russia lies in sixth place in the corresponding regional ranking with 0.04%. This is 3.9 times higher than in Northern Europe, which posted the lowest figure among all regions (0.01%).
The main categories of network folder threats blocked are worms, spyware, and viruses.
Threat categories
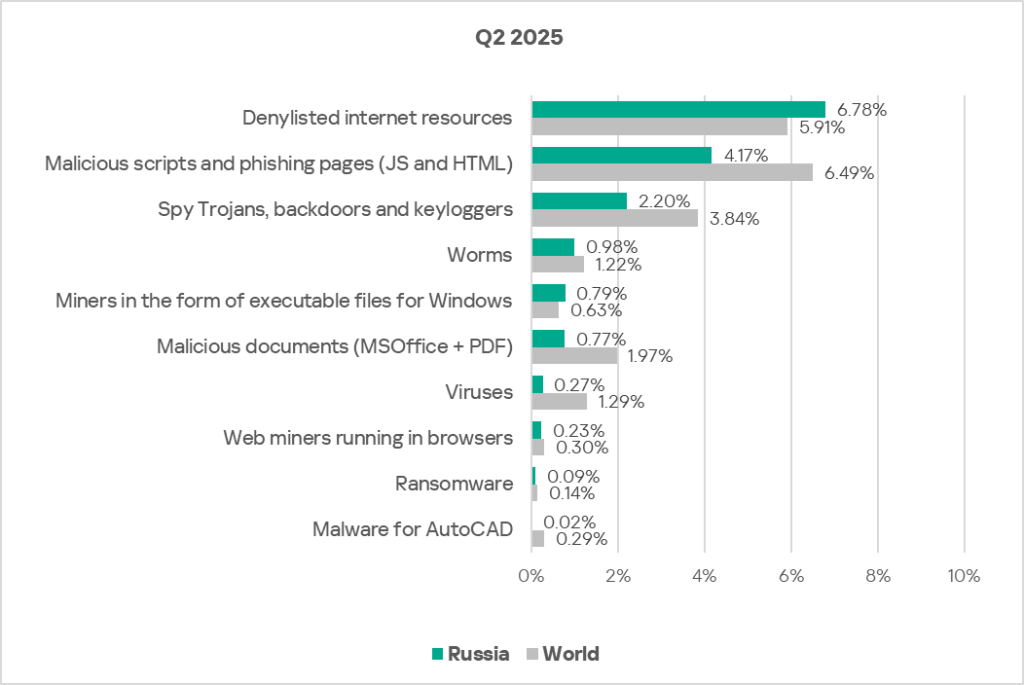
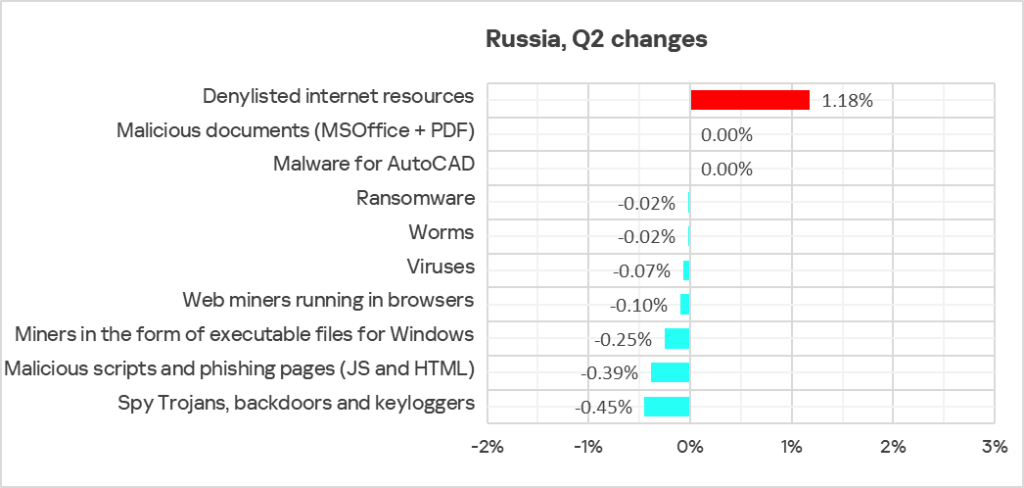
In Russia, the percentage of ICS computers on which malicious objects were blocked exceeds the global average in two threat categories:
- Denylisted internet resources — 1.1 times higher
- Miners in the form of executable files for Windows — 1.3 times higher
Russia ranks second in the regional rankings for both of these categories.
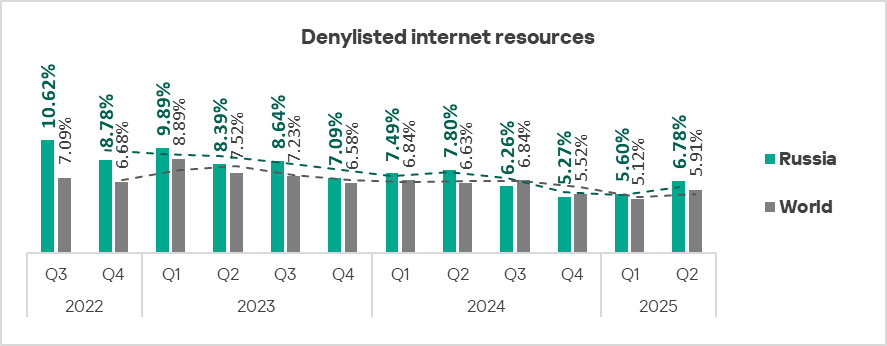
Denylisted internet resources
In the ranking of regions by percentage of ICS computers on which denylisted internet resources were blocked, Russia ranks second, behind only Africa. This is 2.1 times higher than the figure for East Asia at the bottom of the ranking.
Denylisted internet resources are the undisputed leader in the ranking of threat categories in the region. This is the only category for which the indicator increased in Russia in Q2 2025.
Miners in the form of executable files for Windows and worms
Across all regions, Russia ranks second by percentage of ICS computers on which miners in the form of executable files for Windows were blocked, behind only Central Asia and the South Caucasus region. In Russia, this indicator is 4.2 times higher than in the region with the lowest value, East Asia.
The indicator for miners in the form of executable files for Windows decreased in Q2.
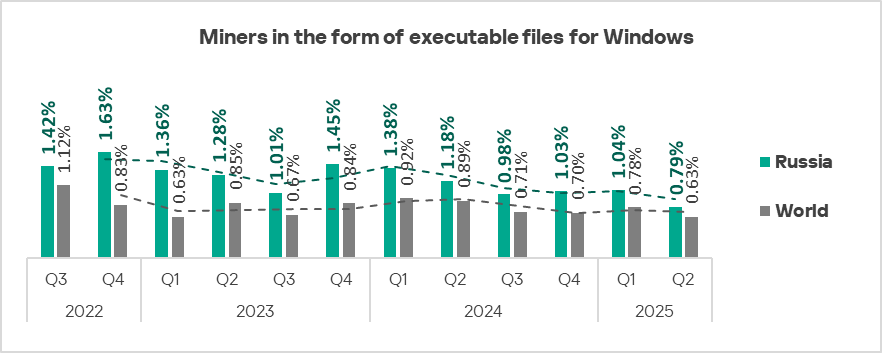
Miners for Windows actively use modules and components that are essentially worms and serve to deliver the miner to other computers in the network (automated lateral movement).
Worms in Q2 2025 in the ranking of threat categories climbed to fourth place. Apart from Russia, only in Central Asia and the South Caucasus region is this threat category in such a high position in the regional ranking.
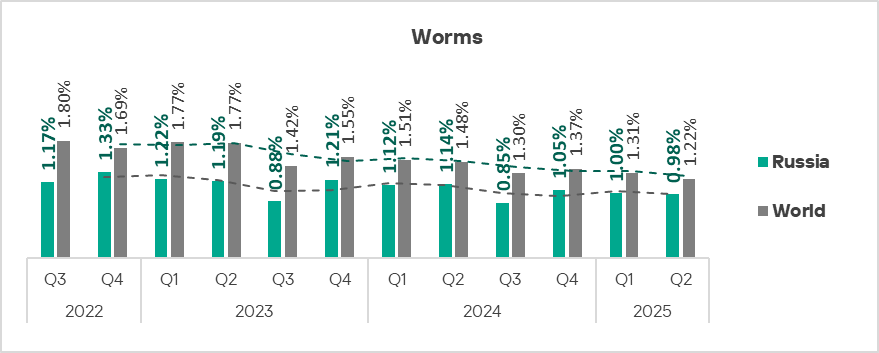
In Russia, the indicators for miners in the form of executable files and for worms show similar dynamics.
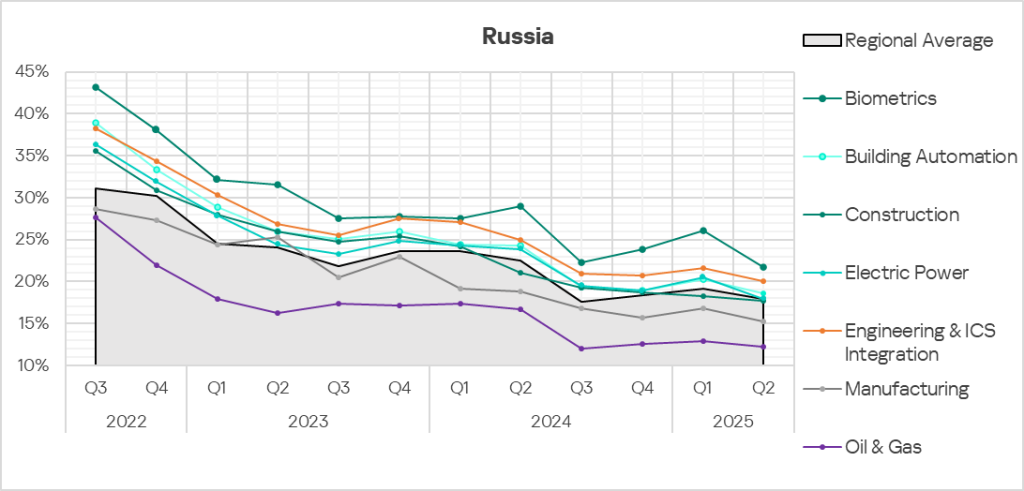
Industries
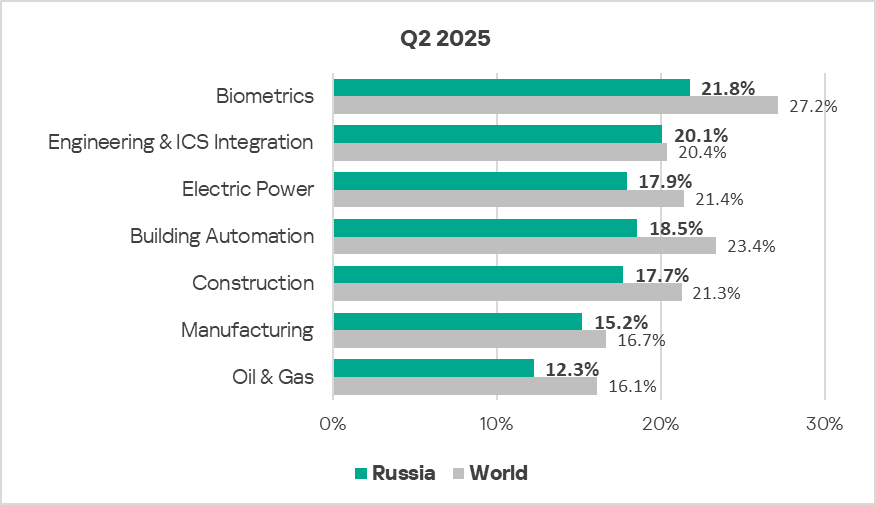
In Russia, of all the industries and OT infrastructures covered in the report, malicious objects are most often blocked in biometric systems.
In all industries in the region, the percentage of ICS computers on which malicious objects were blocked is lower than the corresponding global average.
In Q2 2025, the percentage of ICS computers on which malicious objects were blocked fell in all industries covered in the region.
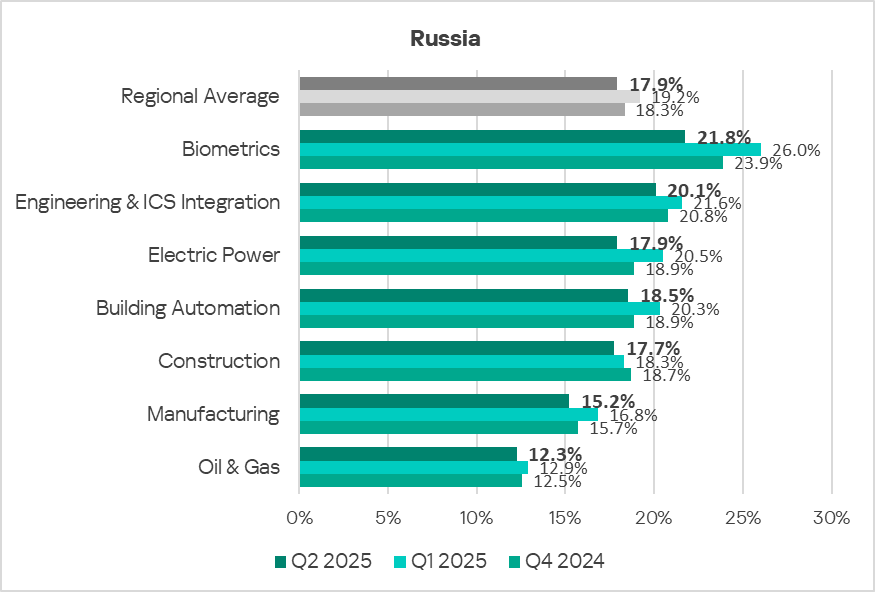
In all the industries covered, the indicators are gradually decreasing, with periodic fluctuations.
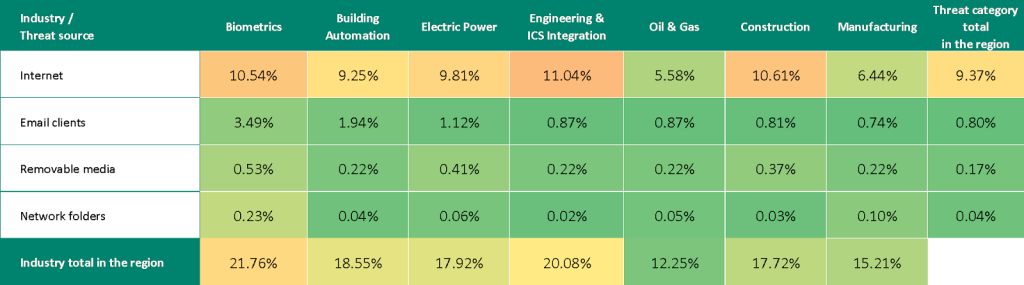
Threat sources and malware categories in industries: hot spots
We use heatmaps to assess threats facing industries. On these maps, cells are colored from red to green, where red indicates the maximum value for a threat source or type among all regions and industries. In Russia, we observed the maximum value for denylisted internet resources blocked on computers in biometric system, as well as internet threats in engineering and ICS integrators.
The heat maps clearly show the industry hot spots, that is, malware sources and categories that place higher than expected in relation to the positions of the industry and the threat or threat source in the corresponding regional rankings.
Threat source indicators for industries in Russia, Q2 2025
Threat category indicators for industries in Russia, Q2 2025
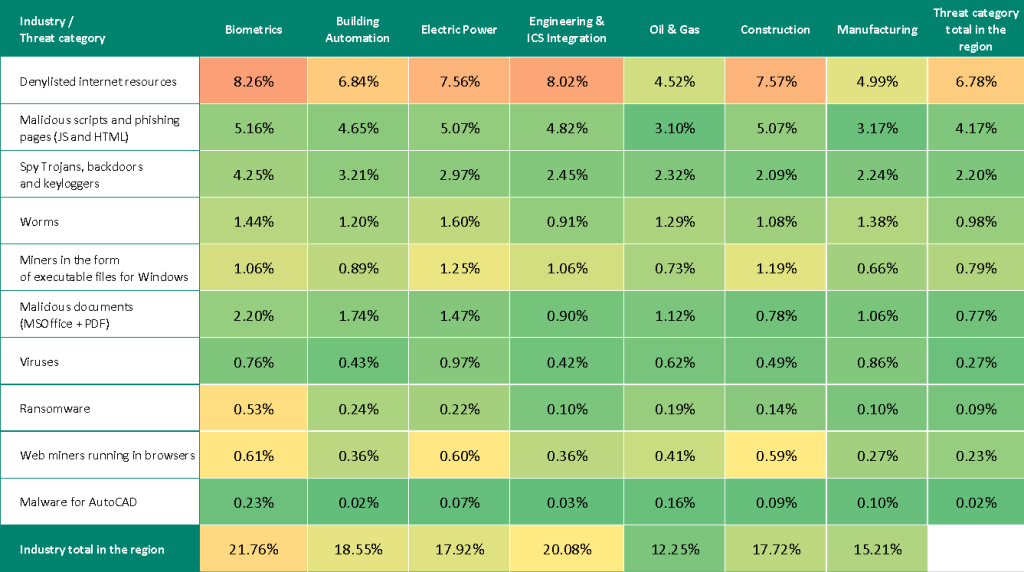
In all industries, the main source of threats is the internet. Therefore, the current threat categories include denylisted links, malicious scripts and phishing pages, and spyware distributed through this threat source. In the electrical energy, construction, and oil and gas industries, the indicators for web miners are also high.
Industry hot spots
Biometric systems
- Leader among industries in terms of all threat sources except the internet (third place).
- Leader among industries in terms of all threat categories except worms (second place), viruses, and miners for Windows (third place).
Engineering and ICS integrators
- Leader among industries in terms of internet threats. All other indicators fall within expected ranges.
Building automation
- Second place among industries in terms of email threats.
- Third place in the following threat categories: malicious documents, spyware, ransomware.
Electrical energy industry
- Second place among industries in terms of removable media threats. Third in terms of email clients and network folders.
- Leader in terms of the following threat categories: worms, viruses, miners in the form of executable files for Windows. Second place in terms of web miners, third in terms of the following categories: malicious scripts and phishing pages, spyware, malicious documents, ransomware.
Construction
- Second place among industries in terms of internet threats. Third in terms of removable media threats.
- Second place in terms of malicious scripts and phishing pages, as well as miners for Windows. Third place in terms of denylisted resources, as well as web miners.
Manufacturing
- Second place among industries in terms of network folder threats.
- Second place in terms of viruses, third in terms of worms and malware for AutoCAD.
Oil and gas industry
- Fourth place in terms of email client and network folder threats.
- Second place in the malware for AutoCAD category. Fourth place in terms of the following threat categories: malicious documents, worms, viruses, ransomware.
Methodology used to prepare statistics
This report presents the results of analyzing statistics obtained with the help of Kaspersky Security Network (KSN). The data was received from KSN users who consented to its anonymous sharing and processing for the purposes described in the KSN Agreement for the Kaspersky product installed on their computer.
The benefits of joining KSN for our customers include faster response to previously unknown threats and a general improvement in the quality of detection by their Kaspersky installation achieved by connecting to a cloud-based repository of malware data that is not transferable to the customer in its entirety by nature of its size and the amount of resources that it uses.
Data shared by the user contains only the data types and categories described in the appropriate KSN Agreement. This data helps to a significant extent in analyzing the threat landscape and serves as a prerequisite for detecting new threats including targeted attacks and APTs1.
Statistical data presented in the report was obtained from ICS computers that were protected with Kaspersky products and which Kaspersky ICS CERT categorized as enterprise OT infrastructure. This group includes Windows computers that serve one or several of the following purposes:
- Supervisory control and data acquisition (SCADA) servers
- Building automation servers
- Data storage (Historian) servers
- Data gateways (OPC)
- Stationary workstations of engineers and operators
- Mobile workstations of engineers and operators
- Human machine interface (HMI)
- Computers used to manage technological and building automation networks
- Computers of ICS/PLC programmers
Computers that share statistics with us belong to organizations from various industries. The most common are the chemical industry, metallurgy, ICS design and integration, oil and gas, energy, transport and logistics, the food industry, light industry, pharmaceuticals. This also includes systems from engineering and integration firms that work with enterprises in a variety of industries, as well as building management systems, physical security, and biometric data processing.
We consider a computer as attacked if a Kaspersky security solution blocked one or more threats on that computer during the period under review: a month, six months, or a year depending on the context as can be seen in the charts above. To calculate the percentage of machines whose malware infection was prevented, we take the ratio of the number of computers attacked during the period under review to the total number of computers in the selection from which we received anonymized information during the same period.
- We recommend that organizations subject to restrictions on sharing any data outside the corporate perimeter consider using Kaspersky Private Security Network. ↩︎