30 April 2026
Threat landscape for industrial automation systems. Australia and New Zealand, Q4 2025
Australia and New Zealand
Key cybersecurity issues in the region
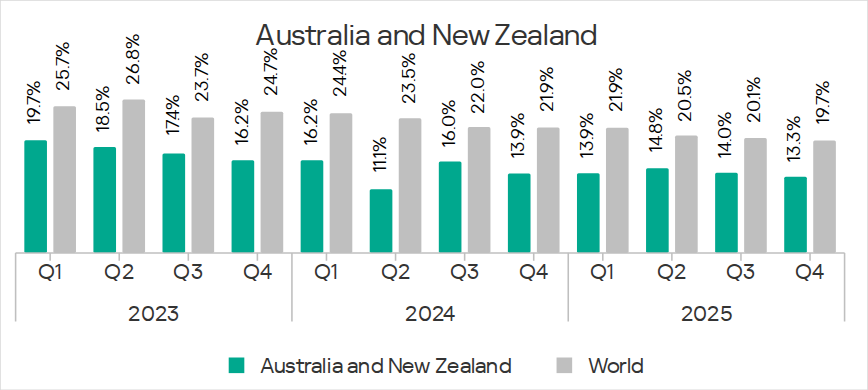
The cybersecurity situation in Australia and New Zealand is among the most favorable across all regions. In Q4 2025, the region ranked 11th in the percentage of ICS computers on which malicious objects were blocked.
The region ranked highest for the following threat sources:
- Seventh place in terms of threats from the internet.
- Seventh place in terms of threats from email clients.
Australia and New Zealand was one of the five regions that saw an increase in the percentage of ICS computers on which threats from the internet were blocked. The region ranked third in terms of growth for this indicator.
In the ratings of regions by percentage of ICS computers on which malicious objects of various categories were blocked, the highest positions for the Australia and New Zealand region were in the following categories:
- Seventh place in ransomware
- Eighth place in malicious scripts and phishing pages
- Ninth place in malicious documents
- Ninth place in web miners
The relatively high percentage values for threats distributed via email clients (phishing) and malicious scripts may indicate that OT systems in the region are accessible to more advanced threat actors.
Attackers use malicious scripts for a variety of purposes, including data collection, tracking, redirecting the user’s browser to malicious web resources, and downloading various malware to the system or browser (such as spyware, cryptominers, and ransomware). These scripts are distributed via the internet and through emails.
Threat actors send malicious documents in phishing messages and use them in initial infection attacks. Malicious documents usually contain exploits, malicious macros, and malicious links.
In Q4 2025, the region saw an increase in the percentage of ICS computers on which the following categories of malicious objects were blocked:
- Web miners: 1.7 times higher, the region ranked first in terms of growth
- Ransomware: 1.6 times higher, second in terms of growth
- Miners in the form of executable files for Windows: 1.5 times higher, second in terms of growth
- Worms: 1.1 times higher
The percentage of miners in both categories increased the most in the building automation sector.
The ransomware rate only increased in the construction and building automation sectors.
The worm rate only increased in building automation.
Country specifics
In Australia, the percentage of ICS computers on which threats from email clients were blocked was 2.2 times higher than in New Zealand.
Accordingly, in Australia, the percentage of threats from email clients was higher than in New Zealand: malicious documents, malicious scripts and phishing pages, and worms (worms spread through email in Q4 2025 during the fresh wave of phishing campaigns known as Curriculum-vitae-catalina). Also, in Australia the percentage of ICS computers on which spyware was blocked was higher than in New Zealand.
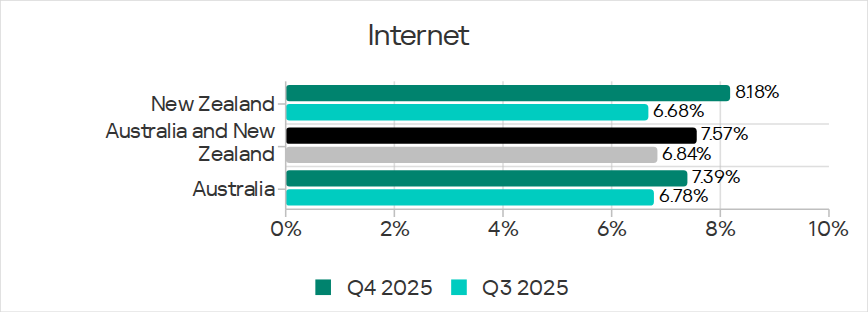
New Zealand ranked ahead of Australia in terms of internet threats. As a result, the region experienced higher rates for threat categories that are distributed via the internet: denylisted internet resources, and miners in both categories.
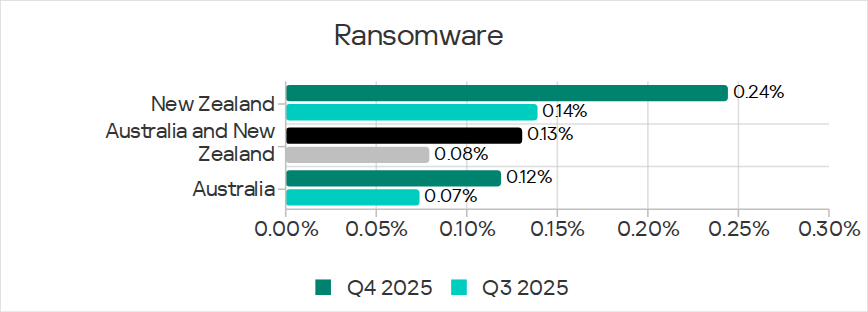
New Zealand also ranked first in terms of ransomware.
Industries
Australia and New Zealand ranked 11th in the regional rankings by percentage of ICS computers on which malicious objects were blocked in various industries.
Among the industries in the region, building automation led in most indicators. This industry was:
- The leader in the growth of miners in both categories.
- One of the two industries where the ransomware rate increased (the other was construction).
- The only industry where the worm rate increased as a result of a phishing attack.
Statistics across all threats
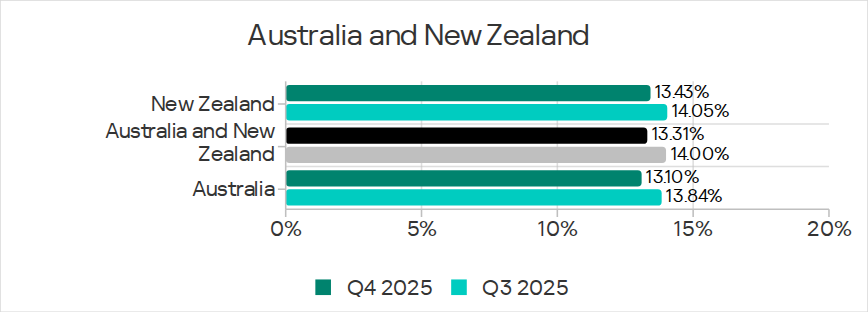
The Australia and New Zealand region ranked 11th among all regions in the percentage of ICS computers on which malicious objects were blocked. The figure of 13.31% was significantly lower than the global average, but 1.6 times higher than that of Northern Europe, which ranked last.
The region’s overall figure largely depends on the situation in Australia. The percentage of ICS computers on which malicious objects were blocked in Australia was lower than in New Zealand. This indicator decreased noticeably in both countries.
Threat sources
In Australia and New Zealand, the percentage of all threat sources was below the global average. Threats from the internet were the closest to the global figure.
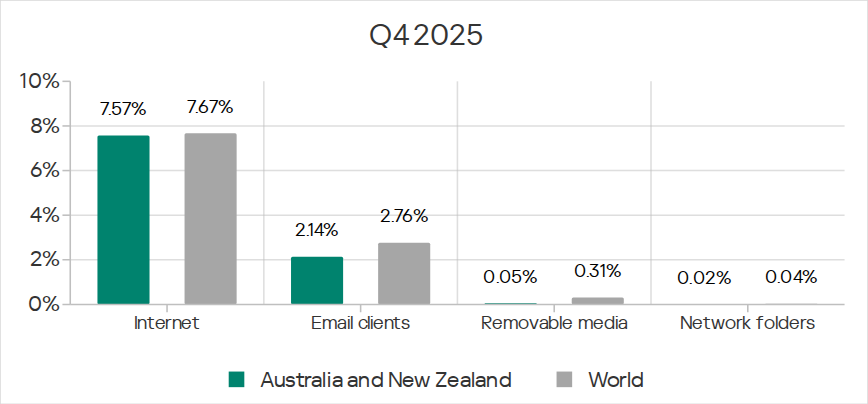
Malicious objects in the region spread primarily via the internet and email. The Australia and New Zealand region ranked seventh in the corresponding regional rankings.
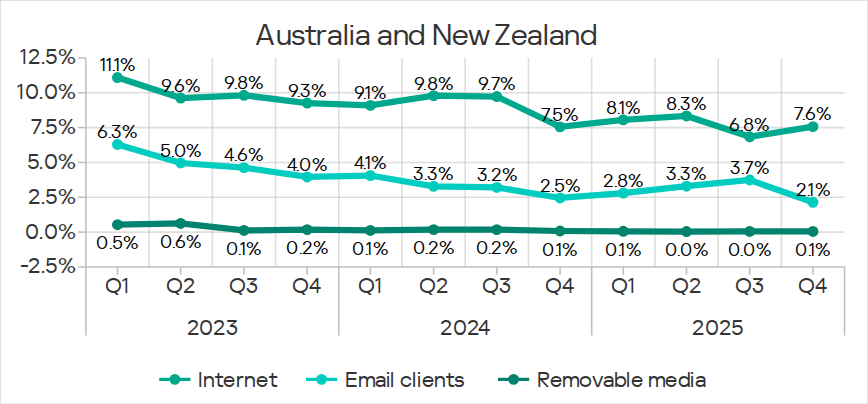
In Q4 2025, the percentage of ICS computers on which malicious objects were blocked increased only for internet threats.
Internet
The Australia and New Zealand region ranked seventh in the percentage of ICS computers on which internet threats were blocked, with 6.84%. This is 1.9 times higher than Northern Europe, which ranked last in this category.
Australia and New Zealand is one of the five regions that saw an increase in the percentage of ICS computers on which threats from the internet were blocked. The region ranked third in growth for this indicator.
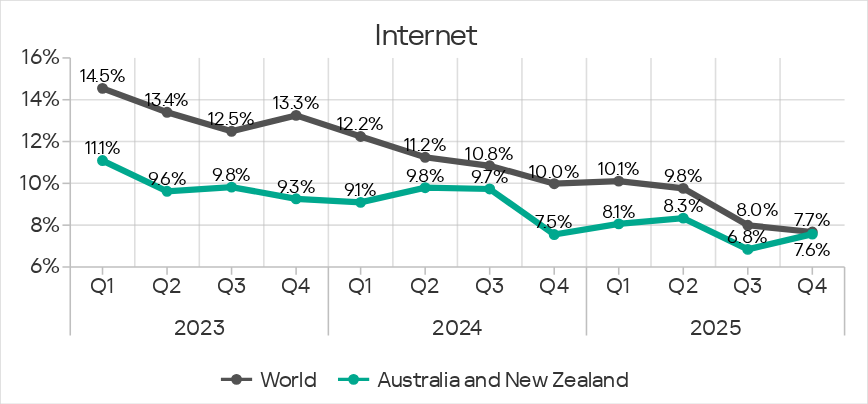
The percentage of ICS computers on which internet threats were blocked during the quarter increased in both countries of the region.
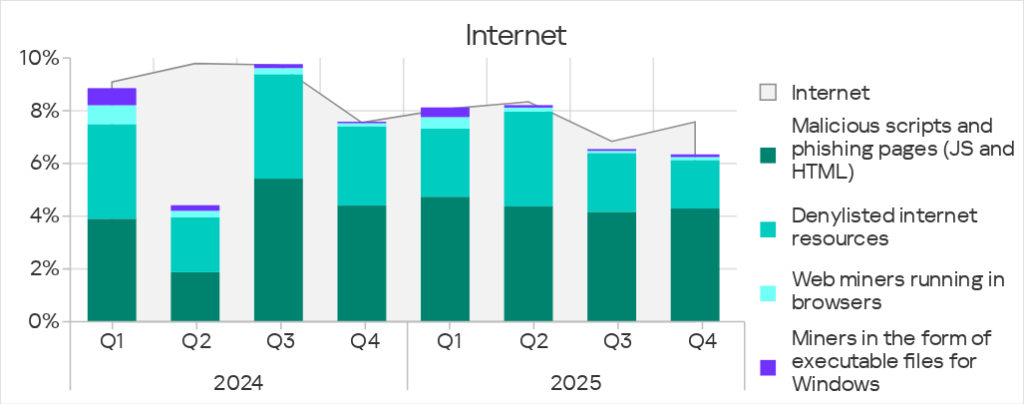
The main internet threat categories blocked on ICS computers in the region were malicious scripts and phishing pages, and denylisted internet resources.
Email clients
In Q4 2025, the region ranked seventh by percentage of ICS computers on which threats from email clients were blocked.
After increasing during the previous three quarters, the figure decreased in Q4 2025 to 2.14%. This is the lowest figure recorded during the review period. It was less than the global average, but 3.5 times higher than that in Northern Europe which ranked last.
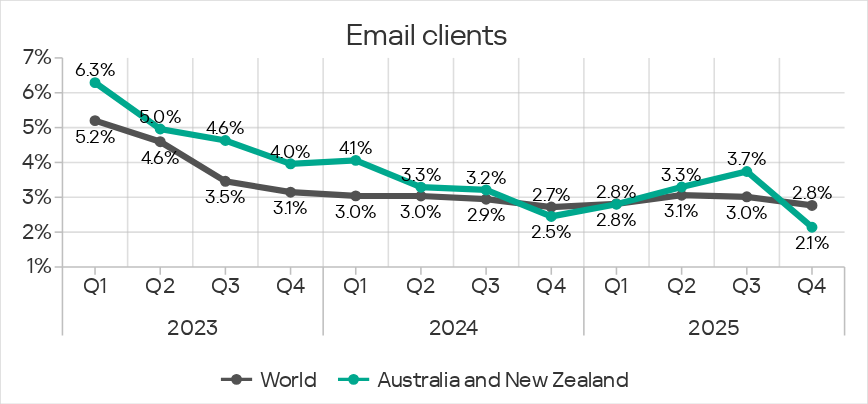
The percentage of ICS computers on which threats from email clients were blocked was 2.2 times higher in Australia than in New Zealand. The figures decreased in both countries.
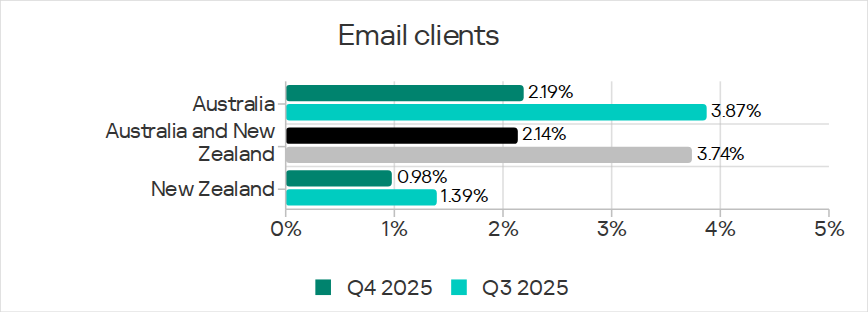
The main email threat categories blocked on ICS computers were malicious scripts and phishing pages, spyware, and malicious documents.
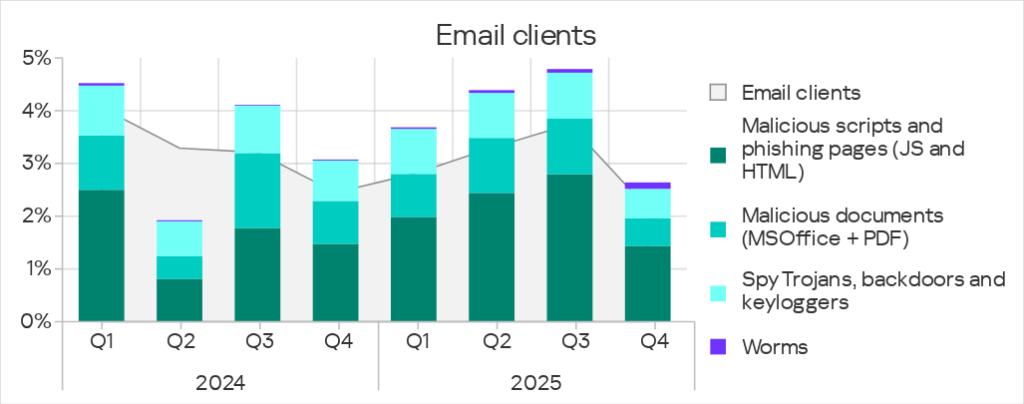
In Q4 2025, the percentage of worms originating from email clients increased in all regions. This increase was due to a new wave of phishing campaigns known as Curriculum-vitae-catalina, in which phishing emails containing a malicious attachment (Backdoor.MSIL.XWorm) disguised as a resume were sent to victims. The worm rate also increased in Australia and New Zealand, but the change was the smallest among the regions.
Removable media
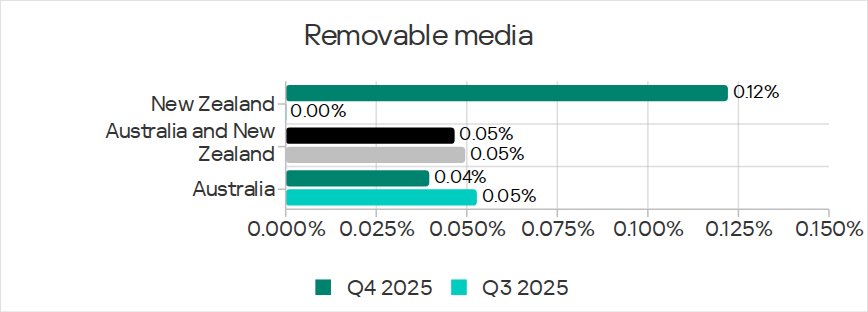
In Q4 2025, the Australia and New Zealand region ranked 14th in the percentage of ICS computers on which threats from removable media were blocked with the lowest rate of all regions (0.05%). This rate remained the same throughout the quarter.
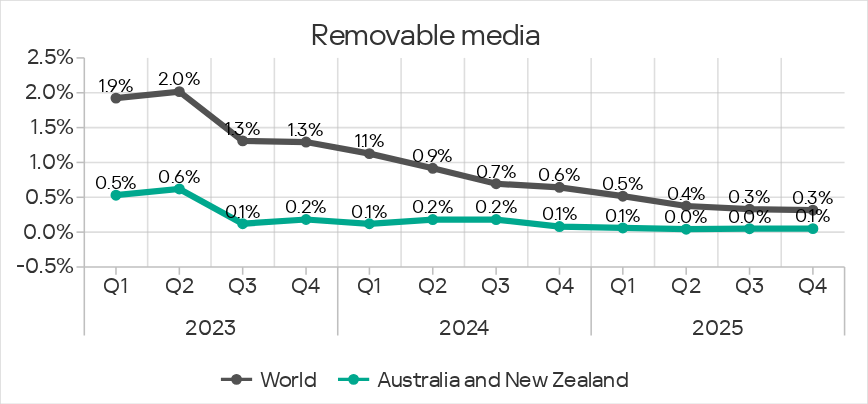
Threats from removable media in the region were blocked predominately in Australia, but in Q4 2025, the rate increased sharply in New Zealand.
The main threat categories blocked on ICS computers from removable media in Q4 2025 were worms and viruses.
Threat categories
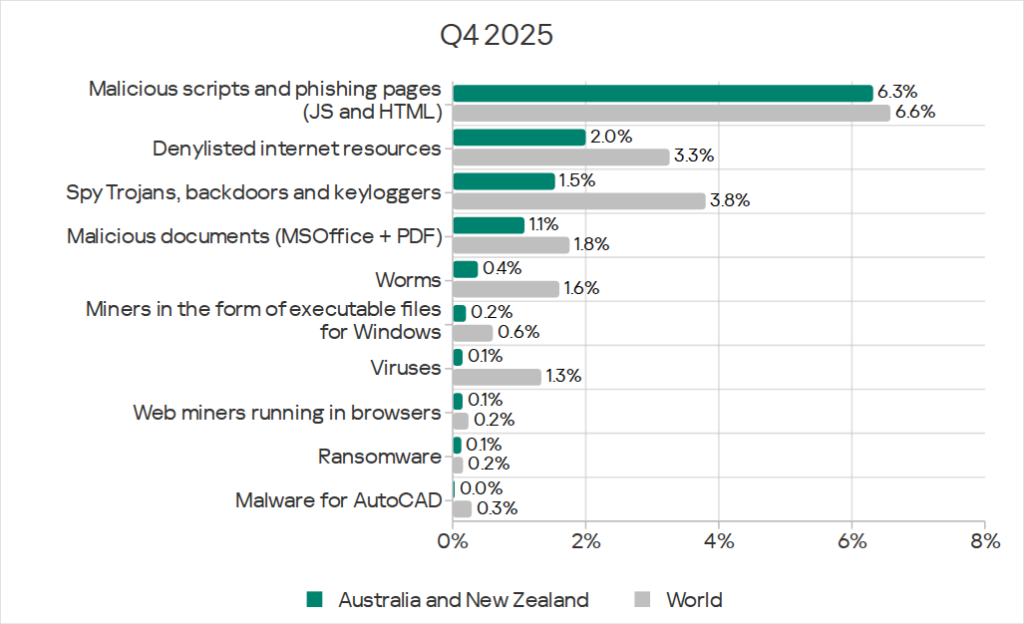
In Q4 2025, the rates of all threat categories in Australia and New Zealand were lower than the global average.
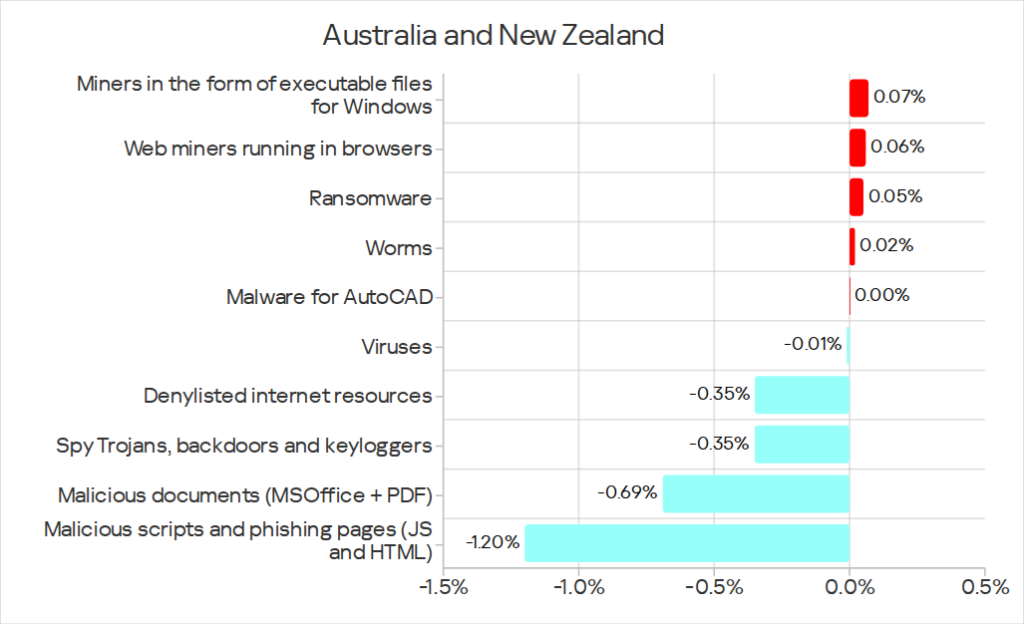
An increase was noted in the percentage of ICS computers on which the following categories of malicious objects were blocked:
- Web miners: 1.7 times higher, the region ranks first in terms of growth
- Ransomware: 1.6 times higher
- Miners in the form of executable files for Windows: 1.5 times higher
- Worms: 1.1 times higher
In the regional rankings by percentage of ICS computers on which malicious objects from various categories were blocked, Australia and New Zealand occupied their highest positions for threats in the following categories.
- Ransomware ranked seventh
- Malicious scripts and phishing pages ranked eighth
- Malicious documents ranked ninth
- Web miners ranked ninth
In the region, the rate of miners in both categories increased the most in building automation.
The ransomware rate increased only in construction and building automation.
The worm rate increased in only one industry, building automation, and only in Australia.
Denylisted internet resources
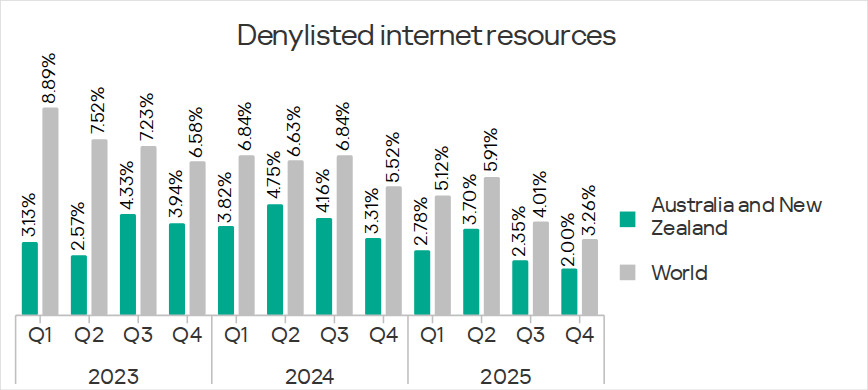
The Australia and New Zealand region ranked 12th in the percentage of ICS computers on which denylisted internet resources were blocked, with 2.00%. This is 1.1 times higher than in Northern Europe, which had the lowest rate.
Like in all regions, the indicator decreased in Australia and New Zealand throughout the quarter.
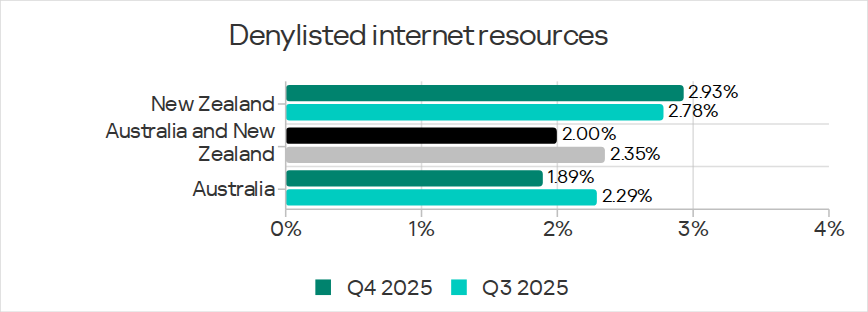
The percentage of ICS computers on which denylisted internet resources were blocked was 1.6 times higher in New Zealand than in Australia.
Malicious scripts and phishing pages
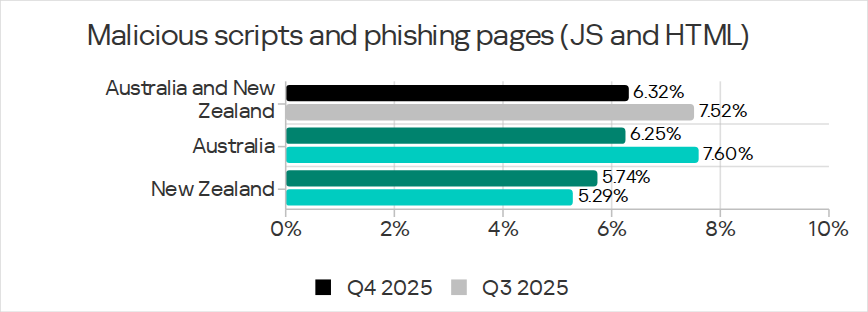
The Australia and New Zealand region ranked eighth in the percentage of ICS computers on which malicious scripts and phishing pages were blocked. This was the region’s highest position in the rankings, both by source and by threat category.
After increasing during the previous three quarters, the figure decreased to 6.32% in Q4 2025. This was 2.5 times higher than the figure in Northern Europe, which ranked last.
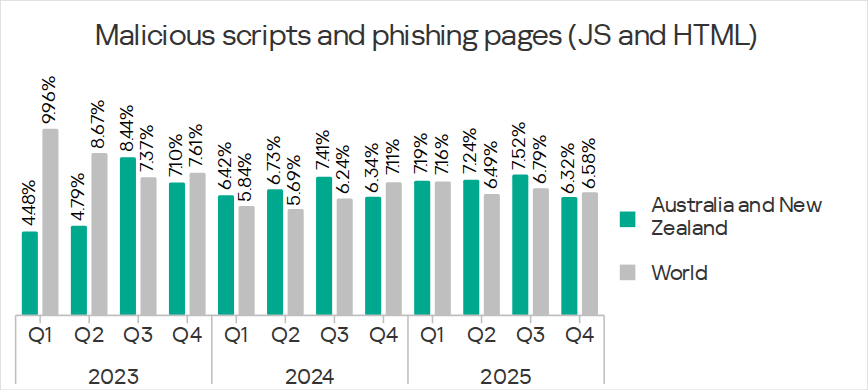
During the quarter, the figure decreased in Australia and increased in New Zealand, but it was still higher in Australia.
In the region, malicious scripts and phishing pages spread primarily via the internet, and they were also detected in email messages.
Malicious scripts can be used by threat actors for a variety of tasks, including loading spyware onto a computer.
Spyware
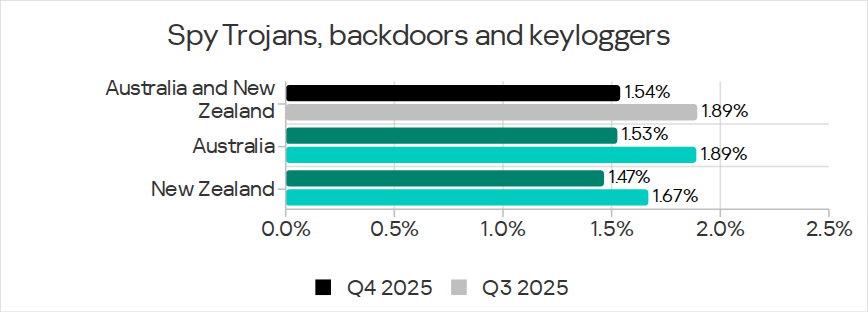
The Australia and New Zealand region ranked 11th in the percentage of ICS computers on which spyware was blocked, with 1.54%. This was 1.2 times higher than in Northern Europe, which had the lowest rate.
The percentage of ICS computers on which spyware is blocked in the region fluctuates. This indicator decreased in Q4 2025.
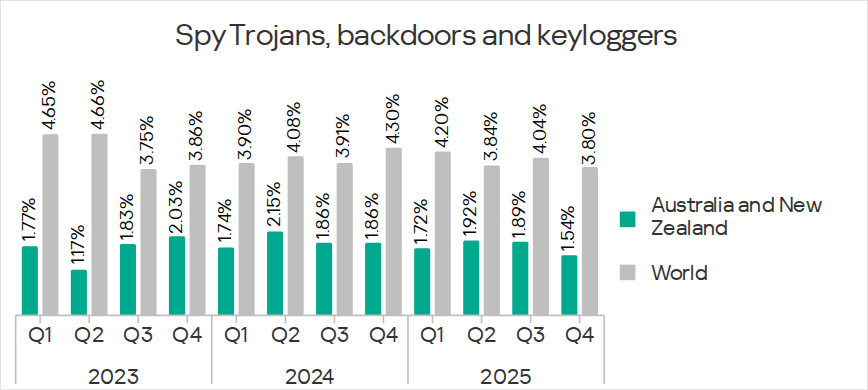
The percentage was higher in Australia than in New Zealand. The figures decreased in both countries throughout the quarter.
Spyware in the region was blocked predominately in email clients.
Malicious documents
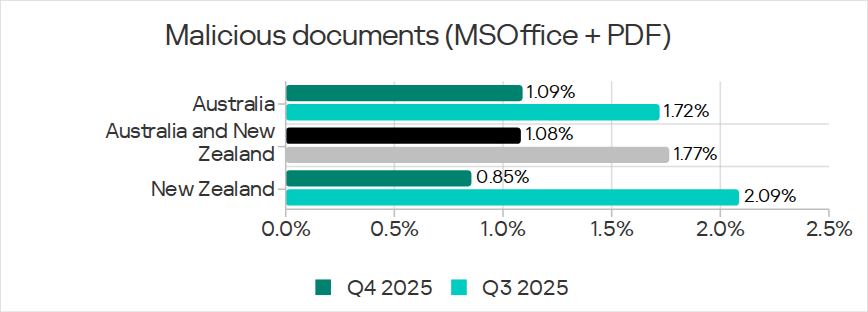
Australia and New Zealand ranked ninth in the percentage of ICS computers on which malicious documents were blocked, with 1.08%. This was 2.3 times higher than in Northern Europe, which ranked last.
The indicator tends to fluctuate in this region. In Q4 2025, it decreased.
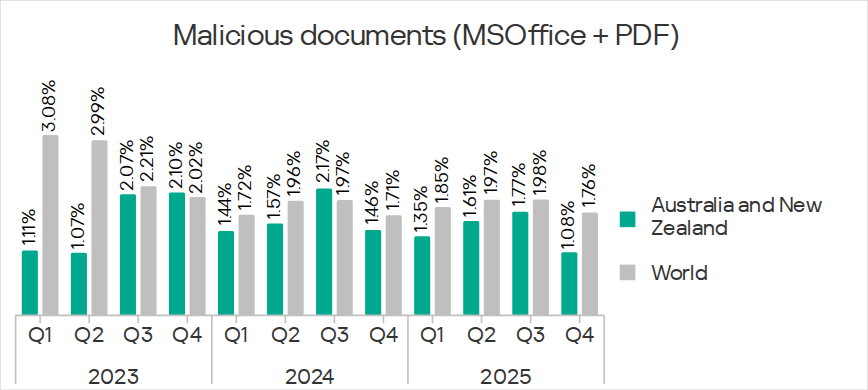
During the quarter, the percentage of ICS computers on which malicious documents were blocked decreased in both countries of the region. Australia regained the lead over New Zealand in this indicator.
Malicious documents were distributed primarily via email.
Worms
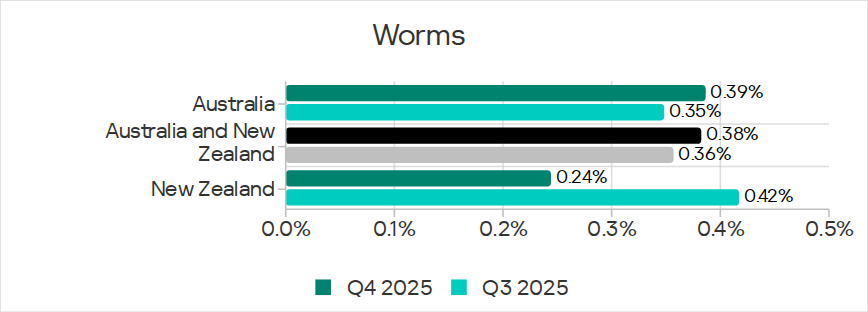
Australia and New Zealand ranked 12th in the percentage of ICS computers on which worms were blocked, with 0.38%. This was 1.2 times higher than in Northern Europe, which had the lowest rate.
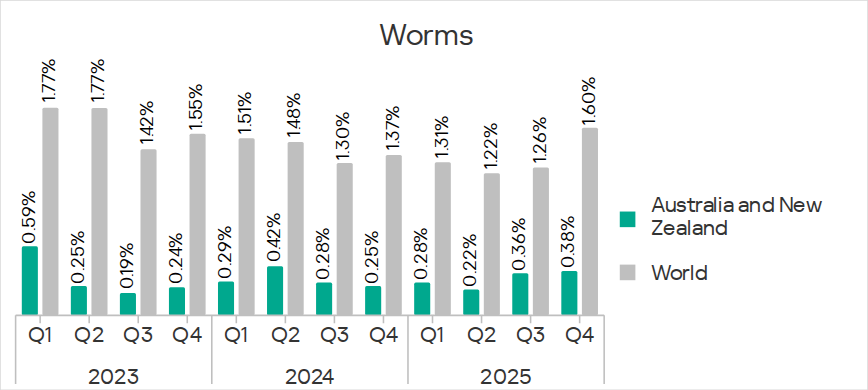
In Q4 2025, the percentage of worms increased in all regions. This was due to the global phishing campaign, known as Curriculum-vitae-catalina, in which phishing emails containing a malicious attachment (Backdoor.MSIL.XWorm) disguised as a resume were sent to victims. The increase in the percentage of ICS computers on which worms were blocked in the region was the smallest among the regions.
The percentage decreased in New Zealand and increased in Australia.
In Q4 2025, worms spread primarily via email clients during the fresh wave of Curriculum-vitae-catalina phishing attacks.
Among industries in the region, the worm rate increased only in the building automation sector.
Miners in the form of executable files for Windows
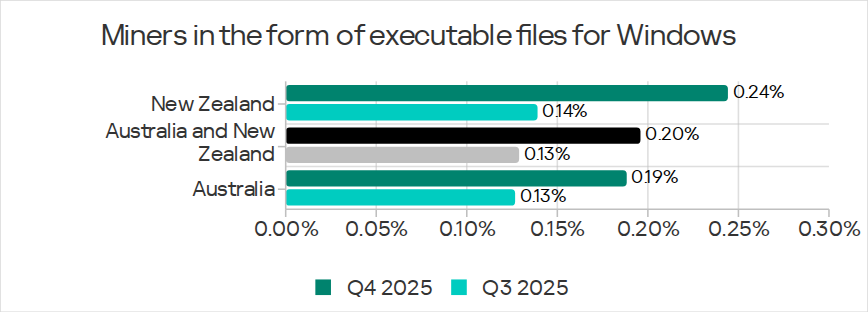
Australia and New Zealand ranked 10th in the percentage of ICS computers on which miners in the form of executable files for Windows were blocked, with 0.20%. This was 1.4 times higher than in North America (Canada), which ranked last.
The Australia and New Zealand region was one of four regions where the rate of miners in the form of executable files for Windows increased during the quarter. The value increased 1.5 times.
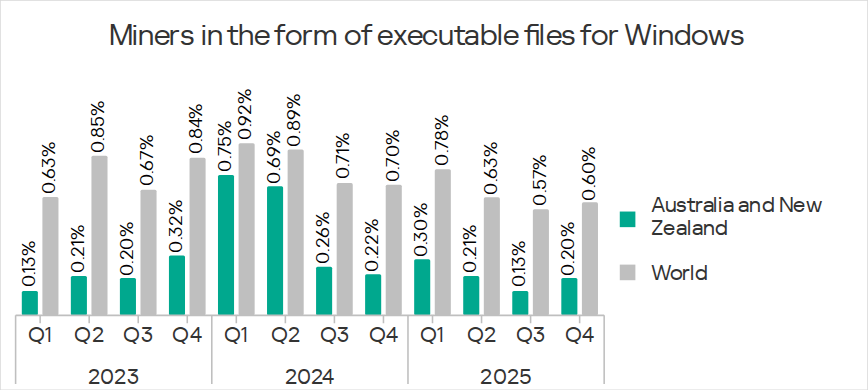
In Q4 2025, the percentage of ICS computers on which miners in the form of executable files for Windows were blocked significantly increased in both countries of the region. The percentage in New Zealand was higher than in Australia.
Miners in the form of executable files for Windows spread on the internet in this region.
Among the region’s industries, the rate of miners in this category increased most in the building automation sector.
Web miners
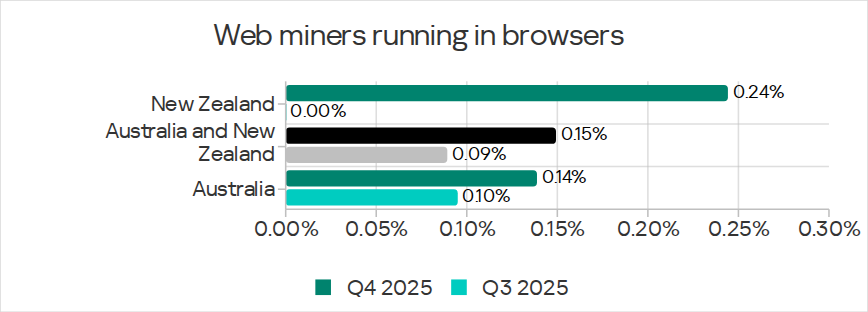
Australia and New Zealand ranked ninth in the percentage of ICS computers on which web miners were blocked, with 0.15%. This was 2.5 times higher than in East Asia, which ranked last.
The Australia and New Zealand region was one of the three regions where the rate of web miners increased during the quarter. It increased by 1.7 times, and the region ranked first in terms of growth.
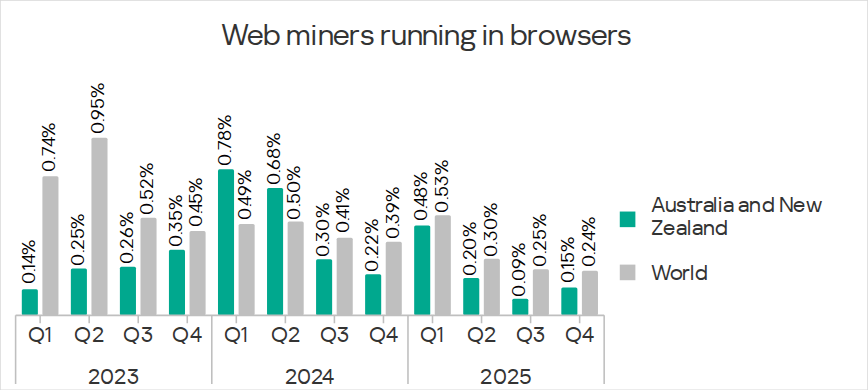
In Q4 2025, the percentage of ICS computers on which web miners were blocked increased in both countries of the region. The percentage in New Zealand was higher than in Australia.
In the region, web miners spread on the internet.
Among the industries in the region, the web miner rate increased the most in building automation.
Ransomware
Australia and New Zealand ranked seventh in the percentage of ICS computers on which ransomware was blocked, with 0.13%.
Australia and New Zealand was one of the three regions where the ransomware rate increased during the quarter. It increased by 1.6 times, with the region ranking second in terms of growth.
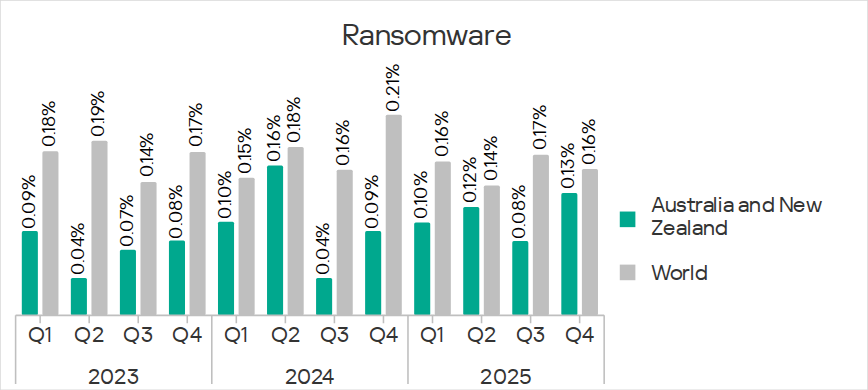
In Q4 2025, the percentage of ICS computers on which ransomware was blocked noticeably increased in both countries of the region. The percentage in New Zealand was higher than in Australia.
The region’s sources of ransomware were the internet and email clients.
Among industries in the region, the ransomware rate only increased in the construction and building automation sectors.
Industries
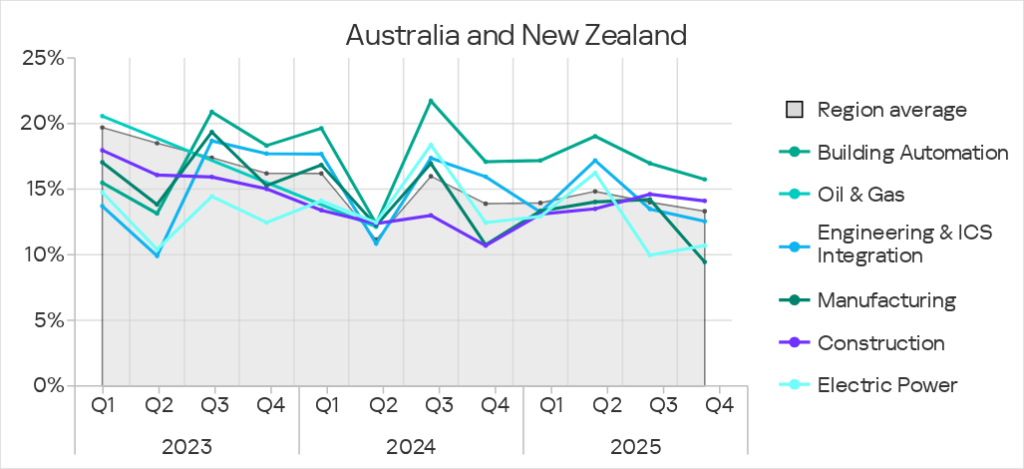
Of the industries reviewed in the report, building automation was the most frequently attacked in Australia and New Zealand. The rates for all the industries studied in the region were significantly lower than the global average.
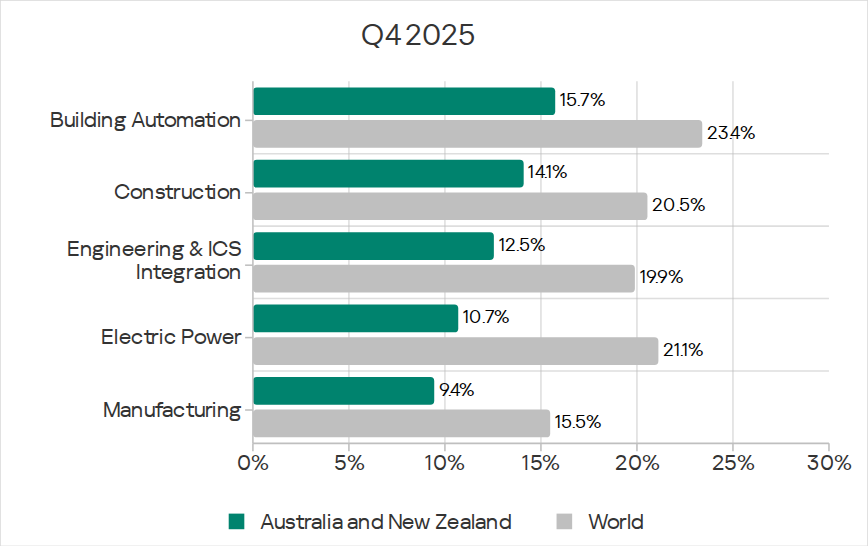
In Q4 2025, the percentage of ICS computers on which malicious objects were blocked decreased across all the reviewed industries except electric power.
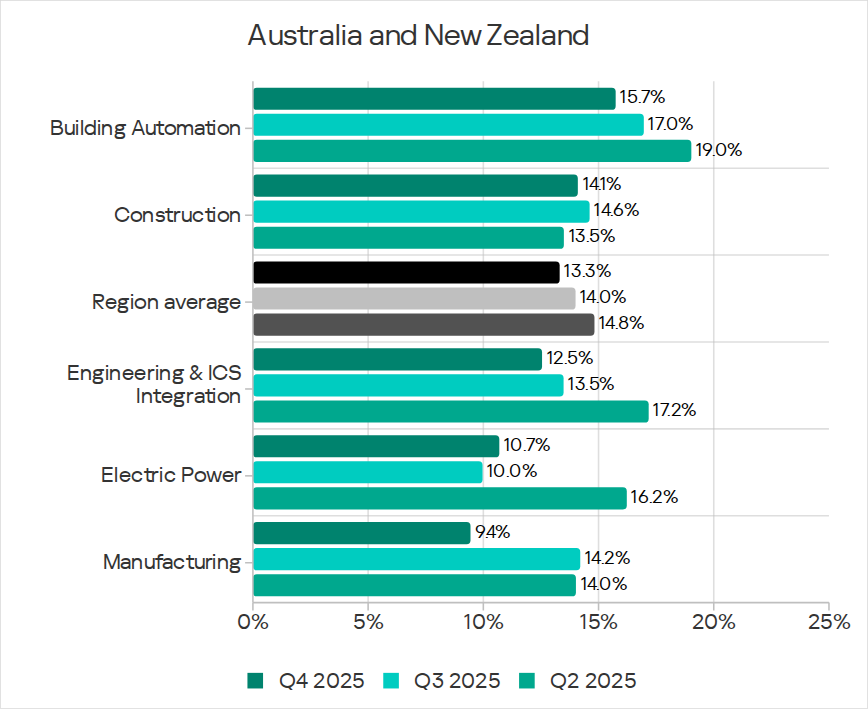
The percentage for building automation was above the regional average.
The percentage for construction was also higher than the region’s average over the previous two quarters. At the same time, the figure for engineering and ICS integrators dropped below the region’s average.
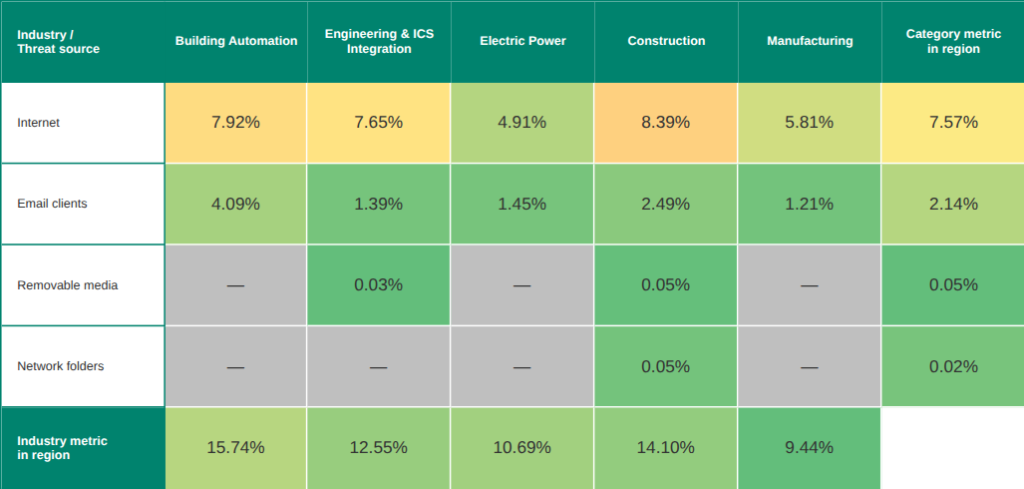
Threat sources and malware categories in industries: ‘hotspots’
We use heat maps when assessing threats to industries in the regions. The color on the heatmap indicates the position in the global industry rankings across regions for each individual threat category or source. Red signifies that the figure is close to the maximum.
Threat source indicators for industries in Australia and New Zealand, Q4 2025
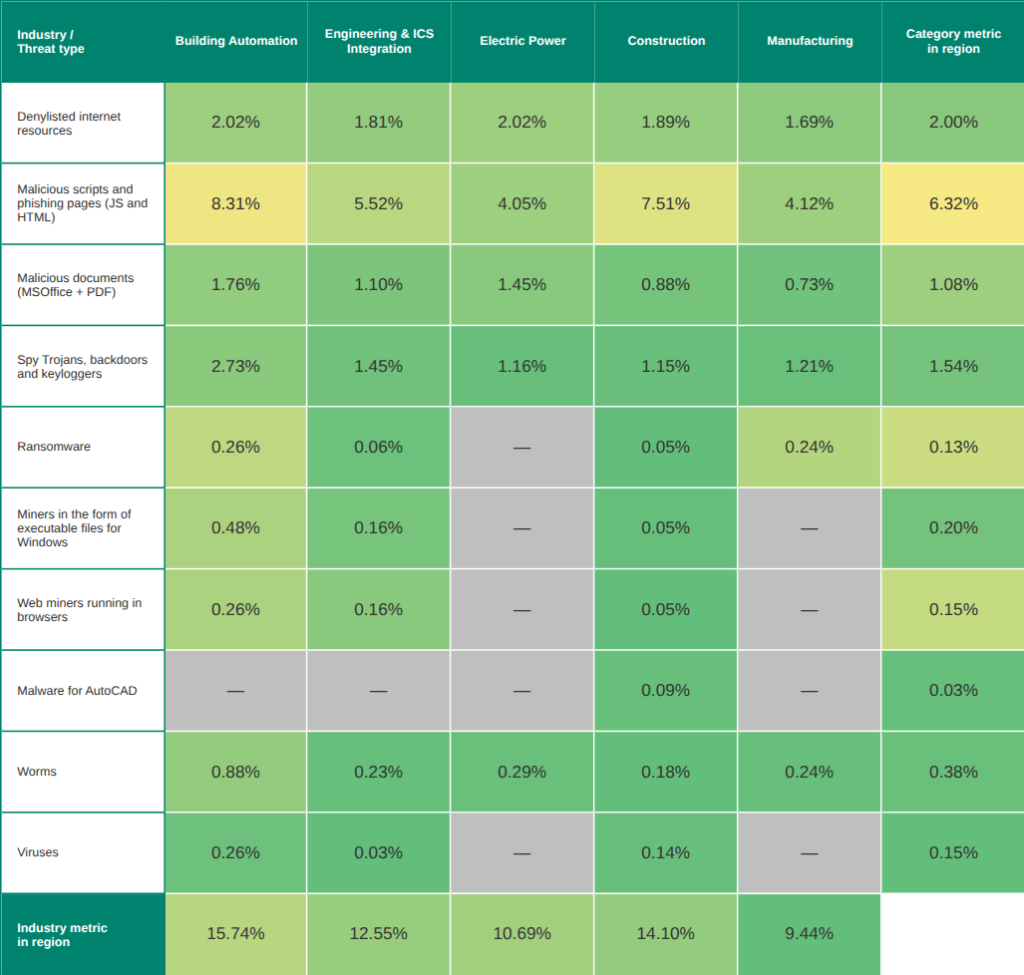
Threat category indicators for industries in Australia and New Zealand, Q4 2025
In the regional rankings by percentage of ICS computers on which malicious objects were blocked in various industries, Australia and New Zealand only got as high as 11th place.
In terms of the regional ratings of threats in various categories in industries, Australia and New Zealand placed highest in building automation for miners of both categories – fifth place in both ratings.
Among the industries in the region, building automation was the leader in terms of threats of all categories, except for denylisted internet resources and malware for AutoCAD.
In Q4 2025, building automation ranked first among the region’s industries in terms of miner rate growth. It was one of two industries where the ransomware rate increased (the other was construction), and the only industry where the worm rate increased.
Building automation
Australia and New Zealand ranked 11th among the regions in terms of the percentage of ICS computers on which malicious objects were blocked in the building automation sector.
In the regional cross-industry rankings, building automation ranked as follows:
- First in the percentage of ICS computers on which threats from email clients and network folders were blocked.
- Third for threats from removable media.
- First in the percentage of ICS computers on which threats of all categories were blocked except denylisted internet resources and malware for AutoCAD.
- Second for denylisted internet resources.
Construction
Australia and New Zealand ranked 11th among the regions in terms of the percentage of ICS computers on which malicious objects were blocked in the construction sector.
In the regional cross-industry rankings, the construction sector ranked:
- Second in the percentage of ICS computers on which threats from removable media were blocked.
- Third for threats from the internet, email clients, and network folders.
- First in the percentage of ICS computers on which malware for AutoCAD was blocked (the only industry in the region where such threats were blocked).
- Second for malicious scripts and phishing pages, and viruses.
- Third in the following categories: denylisted internet resources, ransomware, and miners of both categories.
Engineering and ICS integrators
Australia and New Zealand ranked 11th among the regions in terms of the percentage of ICS computers on which malicious objects were blocked in the engineering and ICS integrators sector.
In the regional cross-industry rankings, engineering and ICS integrators ranked as follows:
- Second in the percentage of ICS computers on which threats from the internet were blocked.
- Second in the percentage of ICS computers on which spyware, ransomware, and miners of both categories were blocked.
- Third in the following categories: malicious scripts and phishing pages, malicious documents, worms, and viruses.
Electric power
Australia and New Zealand ranked 12th among the regions in terms of the percentage of ICS computers on which malicious objects were blocked in the electric power industry.
In the regional cross-industry rankings, the electric power industry ranked:
- First in the percentage of ICS computers on which threats from the internet and removable media were blocked.
- Second for threats from email clients and network folders.
- First in the percentage of ICS computers on which denylisted internet resources were blocked.
- Second for malicious documents and worms.
- Third for spyware.
Methodology used to prepare statistics
This report presents the results of analyzing statistics obtained with the help of Kaspersky Security Network (KSN). The data was received from KSN users who consented to its anonymous sharing and processing for the purposes described in the KSN Agreement for the Kaspersky product installed on their computer.
The benefits of joining KSN for our customers include faster response to previously unknown threats and a general improvement in the quality of detection by their Kaspersky installation achieved by connecting to a cloud-based repository of malware data that is not transferable to the customer in its entirety by nature of its size and the amount of resources that it uses.
Data shared by the user contains only the data types and categories described in the appropriate KSN Agreement. This data helps to a significant extent in analyzing the threat landscape and serves as a prerequisite for detecting new threats including targeted attacks and APTs1.
Statistical data presented in the report was obtained from ICS computers that were protected with Kaspersky products and which Kaspersky ICS CERT categorized as enterprise OT infrastructure. This group includes Windows computers that serve one or several of the following purposes:
- Supervisory control and data acquisition (SCADA) servers
- Building automation servers
- Data storage (Historian) servers
- Data gateways (OPC)
- Stationary workstations of engineers and operators
- Mobile workstations of engineers and operators
- Human machine interface (HMI)
- Computers used to manage technological and building automation networks
- Computers of ICS/PLC programmers
Computers that share statistics with us belong to organizations from various industries. The most common are the chemical industry, metallurgy, ICS design and integration, oil and gas, energy, transport and logistics, the food industry, light industry, pharmaceuticals. This also includes systems from engineering and integration firms that work with enterprises in a variety of industries, as well as building management systems, physical security, and biometric data processing.
We consider a computer to have been attacked if a Kaspersky security solution blocked one or more threats on that computer during the review period: a month, six months, or a year depending on the context as can be seen in the charts above. To calculate the percentage of machines whose malware infection was prevented, we take the ratio of the number of computers attacked during the review period to the total number of computers in the selection from which we received anonymized information during the same period.
- We recommend that organizations subject to restrictions on sharing any data outside the corporate perimeter consider using Kaspersky Private Security Network. ↩︎