
25 August 2026
Threat landscape for industrial automation systems. Q2 2026


Changes over the quarter
In this section, we examine the most significant changes to indicators over the quarter, broken down by region and industry. Further diagrams can be found in the relevant chapters of the “Statistics across all threats” section.
Q2 in numbers
|
Parameter |
Q1 2026 |
Q2 2026 |
Quarterly changes |
|
Global percentage of attacked ICS computers |
19.6% |
19.2% |
▼0.4 pp |
|
Percentage of ICS computers on which malicious objects |
|||
|
Malicious scripts and phishing pages |
6.56% |
5.42% |
▼1.14 pp |
|
Denylisted internet resources |
3.54% |
4.31% |
▲0.77 pp |
|
Spy Trojans, backdoors and keyloggers |
3.73% |
3.30% |
▼0.43 pp |
|
Malicious documents (MSOffice + PDF) |
1.56% |
1.77% |
▲0.21 pp |
|
Worms |
1.33% |
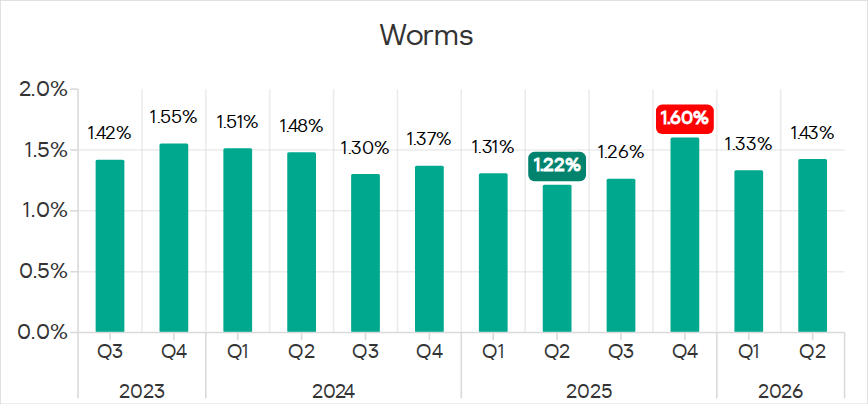
1.43% |
▲0.10 pp |
|
Viruses |
1.31% |
1.29% |
▼0.02 pp |
|
Miners in the form of executable files for Windows |
0.59% |
0.48% |
▼0.11 pp |
|
Malware for AutoCAD |
0.30% |
0.31% |
▲0.01 pp |
|
Ransomware |
0.14% |
0.16% |
▲0.02 pp |
|
Web miners running in browsers |
0.22% |
0.14% |
▼0.08 pp |
|
Main threat sources |
|||
|
Internet |
7.88% |
7.61% |
▼0.27 pp |
|
Email clients |
2.59% |
2.84% |
▲0.25 pp |
|
Removable media |
0.26% |
0.24% |
▼0.02 pp |
|
Network folders |
0.03% |
0.02% |
▼0.01 pp |
All threats
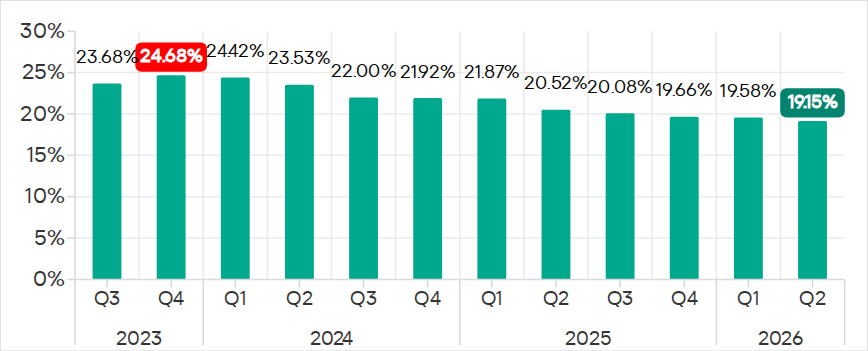
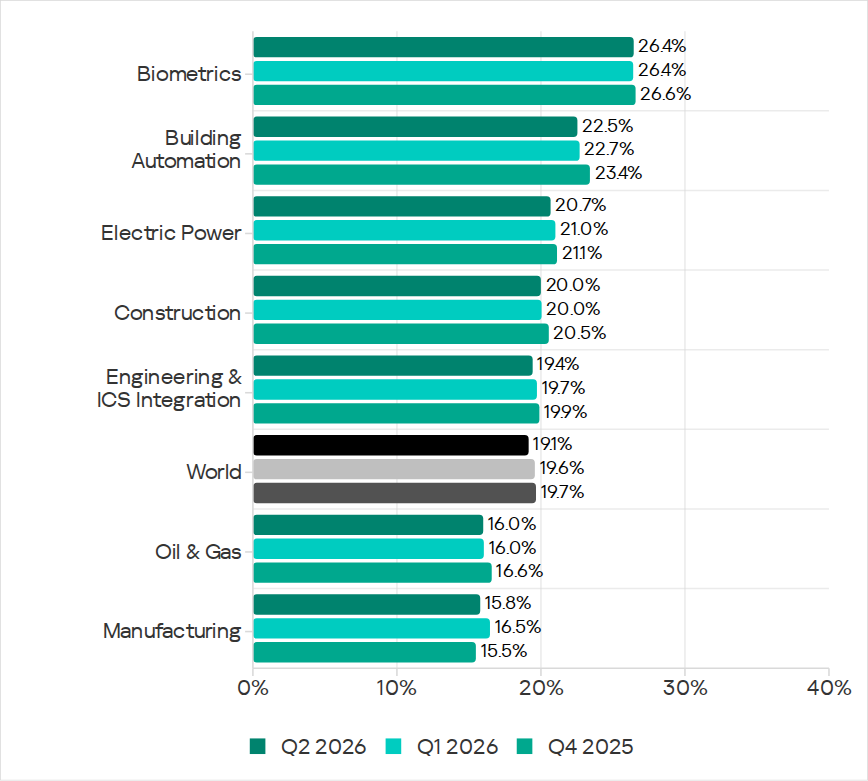
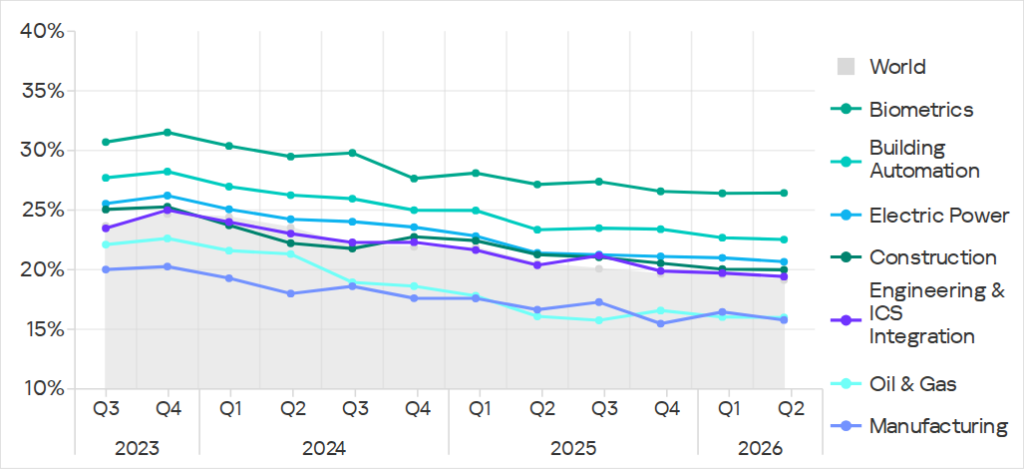
In Q2 2026, the percentage of ICS computers on which malicious objects were blocked continued to decrease, reaching its lowest level since 2022 — 19.15%.
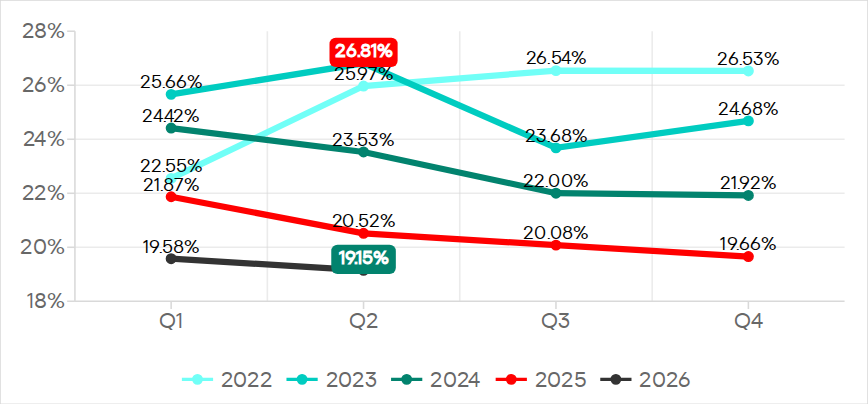
Q1 2022 – Q2 2026
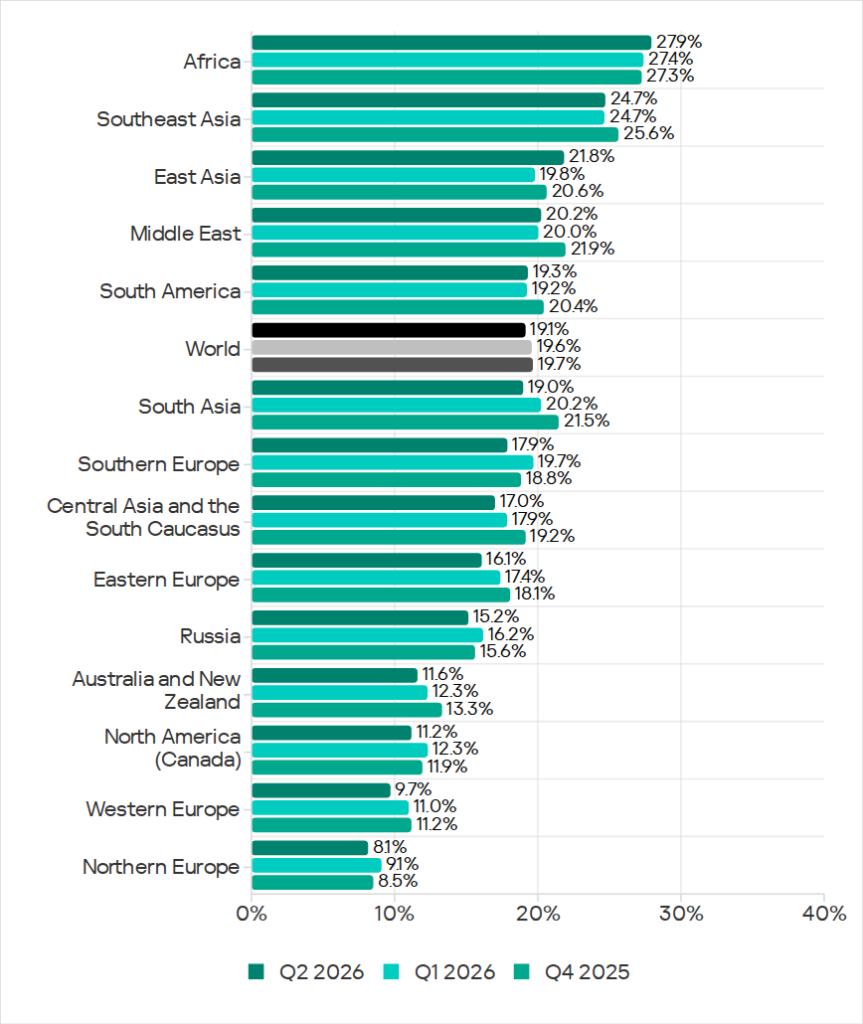
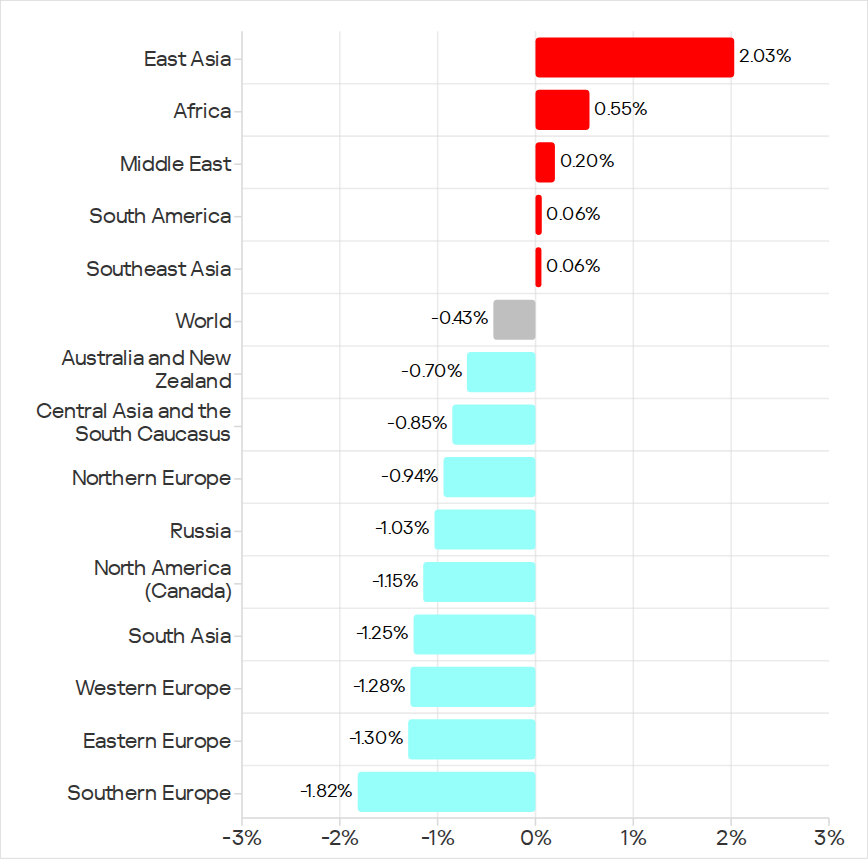
Regionally, the percentage figures ranged from 8.1% in Northern Europe to 27.9% in Africa. The difference between the highest and lowest percentage figures across regions is quite significant: the percentage in Africa is 3.4 times more that in Northern Europe.
The figures increased in five regions over the quarter, most notably in East Asia (by 2.03 pp) and Africa (by 0.55 pp).
In East Asia, the percentage of ICS computers on which malicious objects were blocked increased to 21.84%, exceeding the global average.
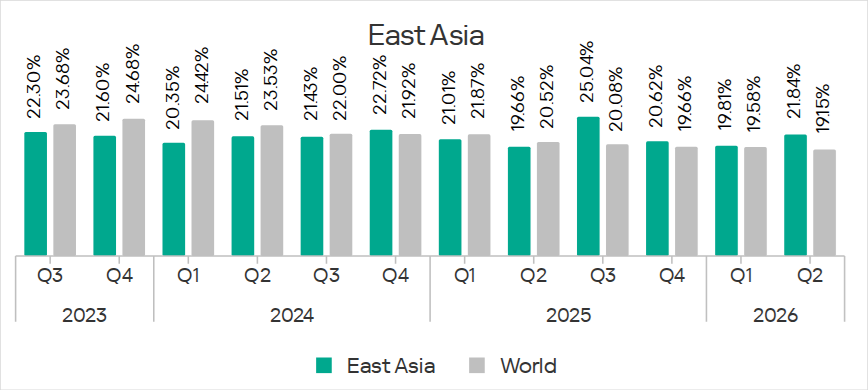
East Asia saw increases in percentage figures for all threats except miners. The region ranked first in terms of growth for malicious scripts and phishing pages, spyware and viruses. East Asia also led in terms of growth in threats from the internet. The percentage of ICS computers on which threats from email clients were blocked also increased.
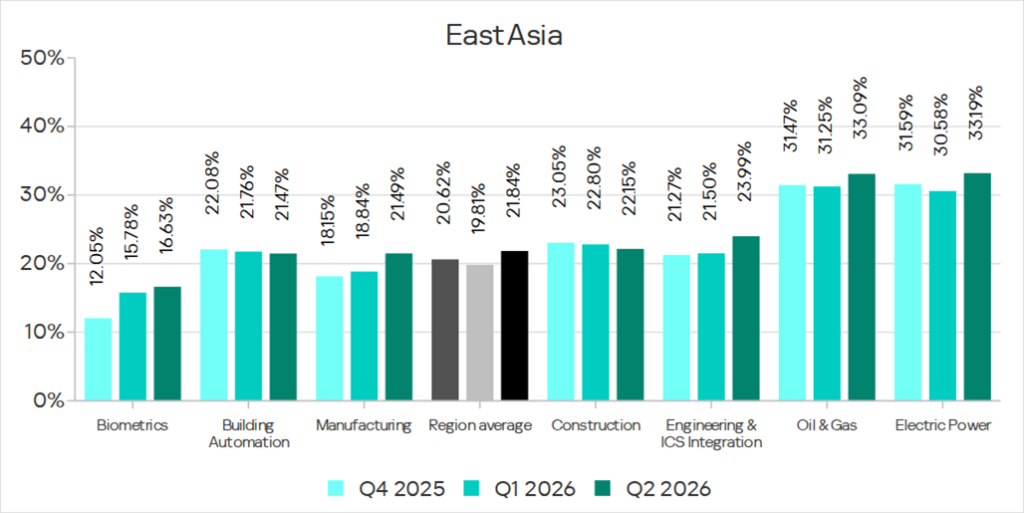
In the region, all the surveyed industries saw an increase in percentage figures, except for building automation and construction.
The indicator fluctuates in Africa. During the period under review it was the highest it had been since Q2 2025.
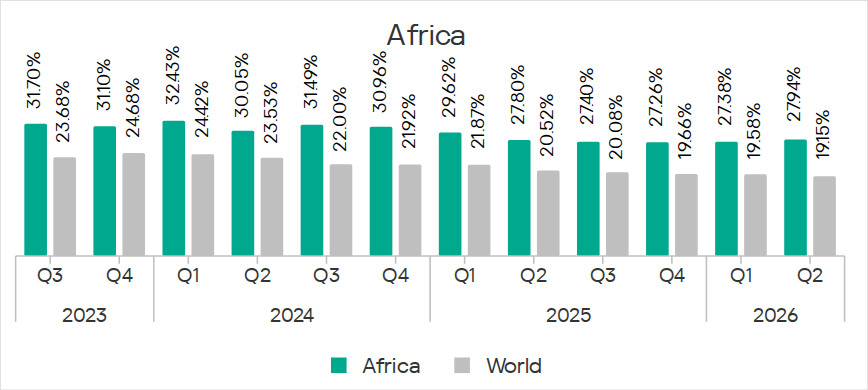
Among the threat categories, the greatest increase was observed in the percentage figures for denylisted internet resources. Africa ranked first in terms of growth for ransomware and malware for AutoCAD, and third for both categories of self-propagating malware (worms and viruses). The region also ranked second in terms of growth for email client threats.
Selected industries
The biometrics sector has traditionally led the ranking of industries and OT infrastructure surveyed in this report in terms of the percentage of ICS computers on which malicious objects were blocked, with 26.44%.
These systems are characterized by the availability of internet access, extensive email use, and, in many cases, minimal cybersecurity controls within the organizations that use these systems.
The biometrics sector ranked first among industries in terms of the following threat categories: malicious scripts and phishing pages, malicious documents, spyware, ransomware, worms. This sector is the leader among industries in terms of email threats. At the same time, unlike other industries, the percentage figure for email threats in biometrics exceeds that for internet threats.
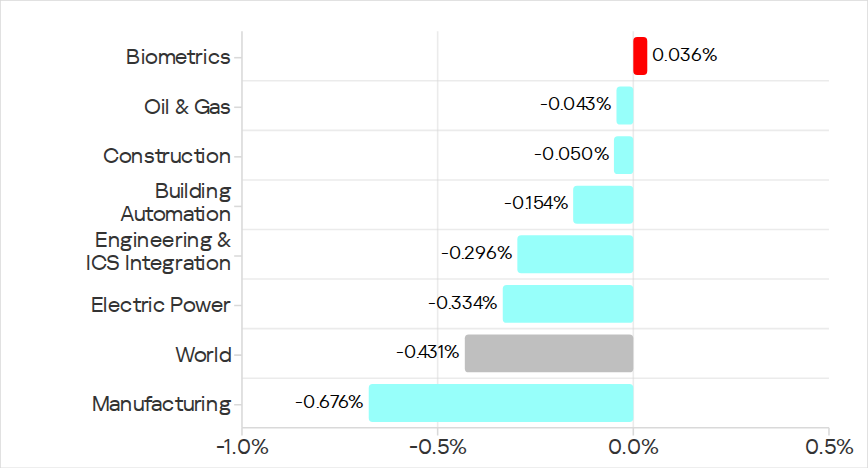
In Q2 2026, the percentage figure of the biometrics sector increased slightly, while the values for other surveyed industries decreased.
Regionally, Southern Europe leads the ranking based on the percentage figures for biometrics, with 33.28%. The region also ranked first for threats from email clients.
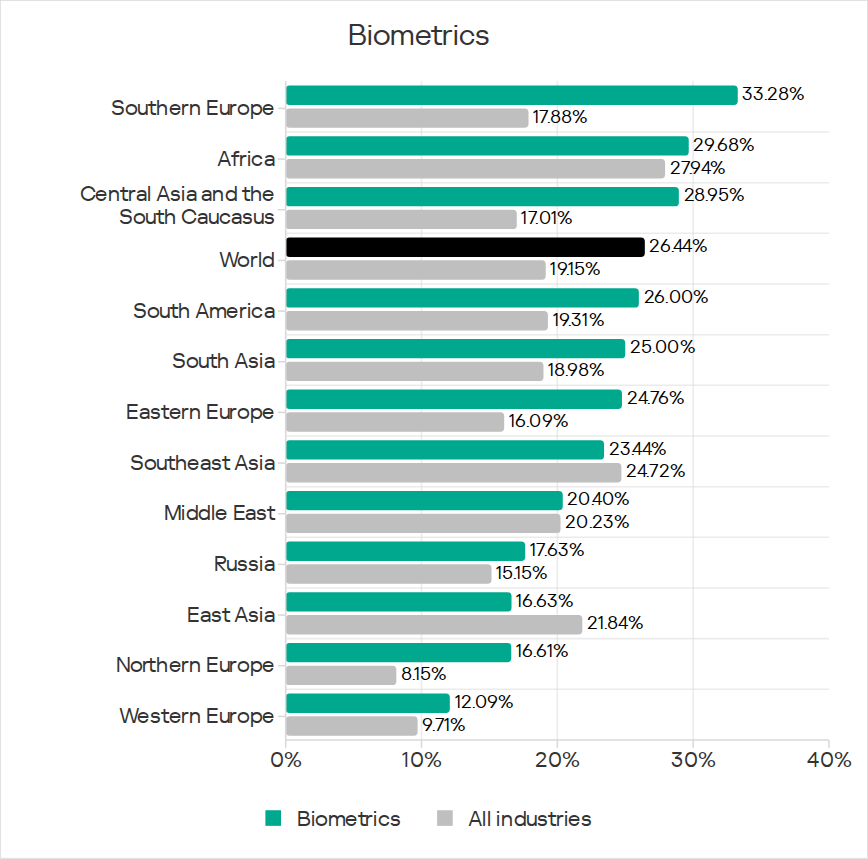
In all selected industries, the global average follows a downward trend.
Threat categories
In Q2 2026, Kaspersky security solutions blocked malware from 10,904 different malware families of various categories on industrial automation systems.
Over the quarter, the percentage of ICS computers on which malicious objects of the following categories were blocked increased: denylisted internet resources, malicious documents, worms, ransomware, and malware for AutoCAD.
Malicious objects used for initial infection
Denylisted internet resources
In Q2 2026, denylisted internet resources rose in the threat category ranking from third to second place, displacing spyware.
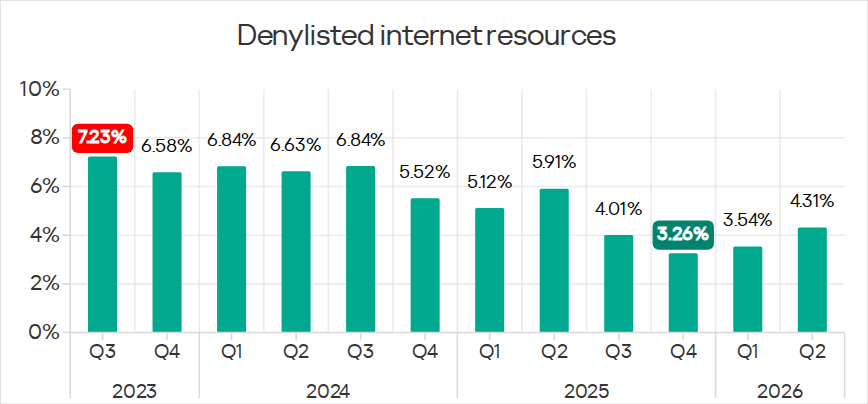
Globally, the percentage of ICS computers on which denylisted internet resources were blocked has increased for two quarters and reached 4.31%.
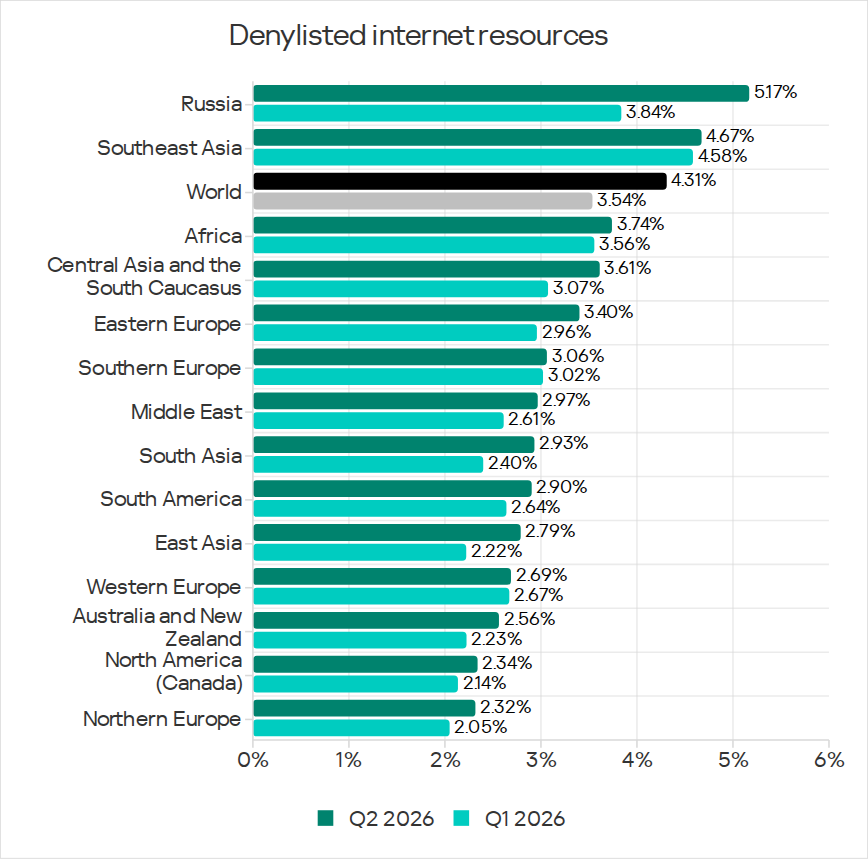
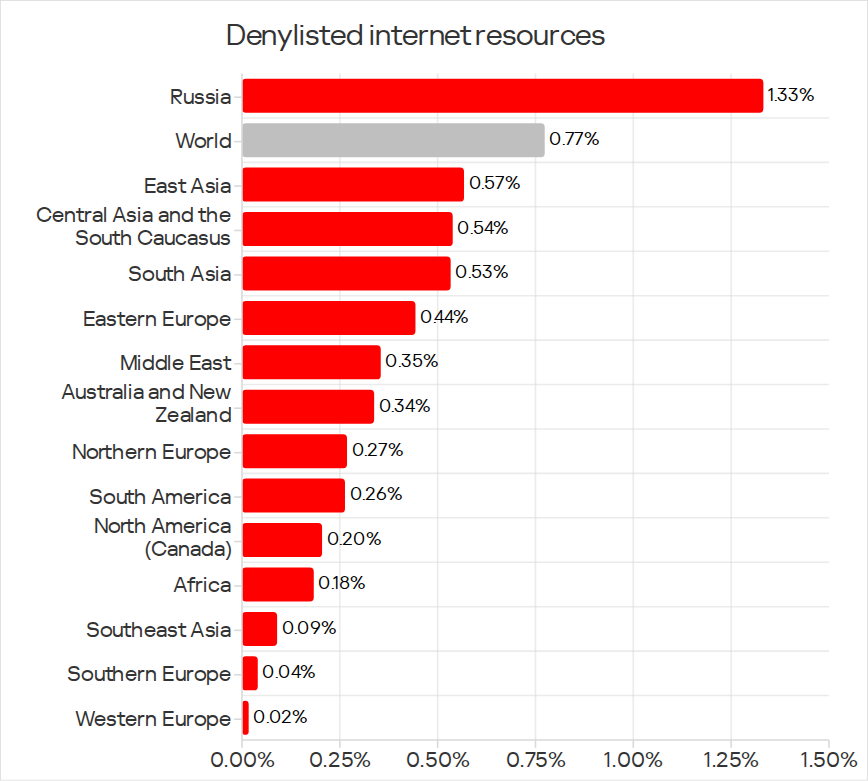
Regionally, the percentage figures ranged from 2.32% in Northern Europe to 5.17% in Russia. The figures increased in all regions over the quarter, most notably in Russia (by 1.33 pp).
In Q2 2026, Russia ranked first among the regions in terms of denylisted internet resources. Since 2022, the region has topped this ranking twice before, both times in Q2: in 2022 and 2024.
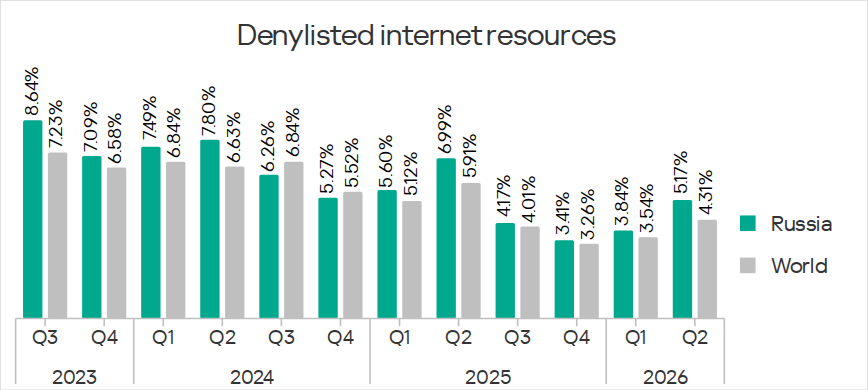
Among the selected industries in Russia, the highest percentage figures for the denylisted internet resources were in the electric power (6.61%) and engineering and ICS integration (5.62%) industries.
On average, the electric power industry led the ranking among the selected industries in terms of the percentage of ICS computers on which denylisted internet resources were blocked (4.72%).
Among the selected industries across all regions, the top five for this parameter are:
- Biometrics in Central Asia and the South Caucasus – 6.73%;
- Electric power in Russia – 6.61%;
- Electric power in Southeast Asia – 6.45%;
- Construction in Southeast Asia – 6.42%;
- Electric power in Central Asia and the South Caucasus – 6.37%.
Malicious scripts and phishing pages (JS and HTML)
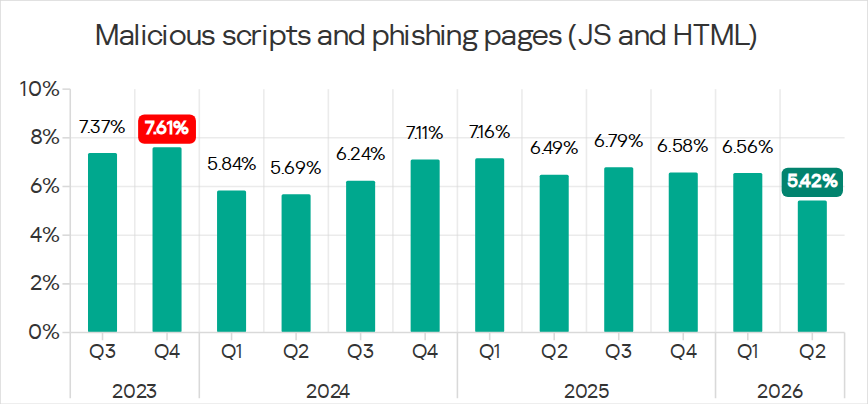
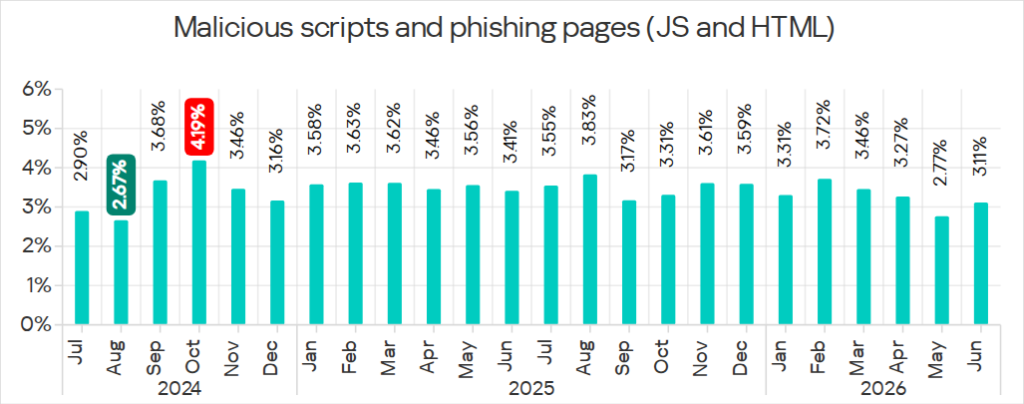
Malicious scripts and phishing pages remained in first place in the threat category ranking based on the percentage of ICS computers on which the respective threats were blocked. In Q2 2026, the global average increased to 5.42%.
Malicious scripts and phishing pages are distributed both on the internet and via email clients.
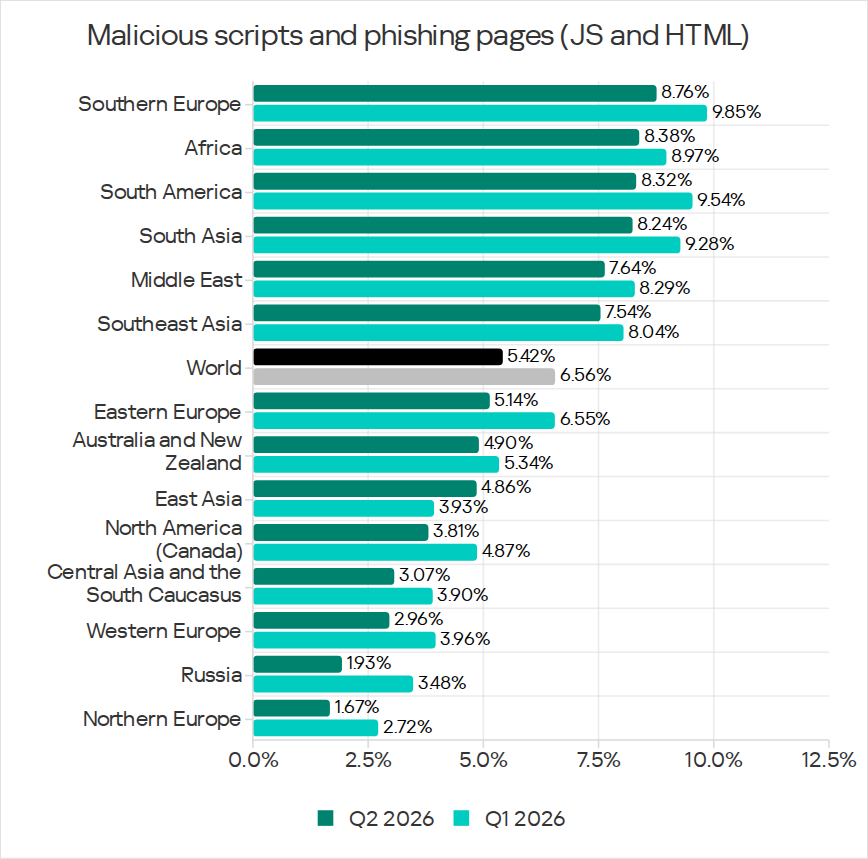
Regionally, the percentage of ICS computers on which malicious scripts and phishing pages were blocked ranged from 1.67% in Northern Europe to 8.76% in Southern Europe.
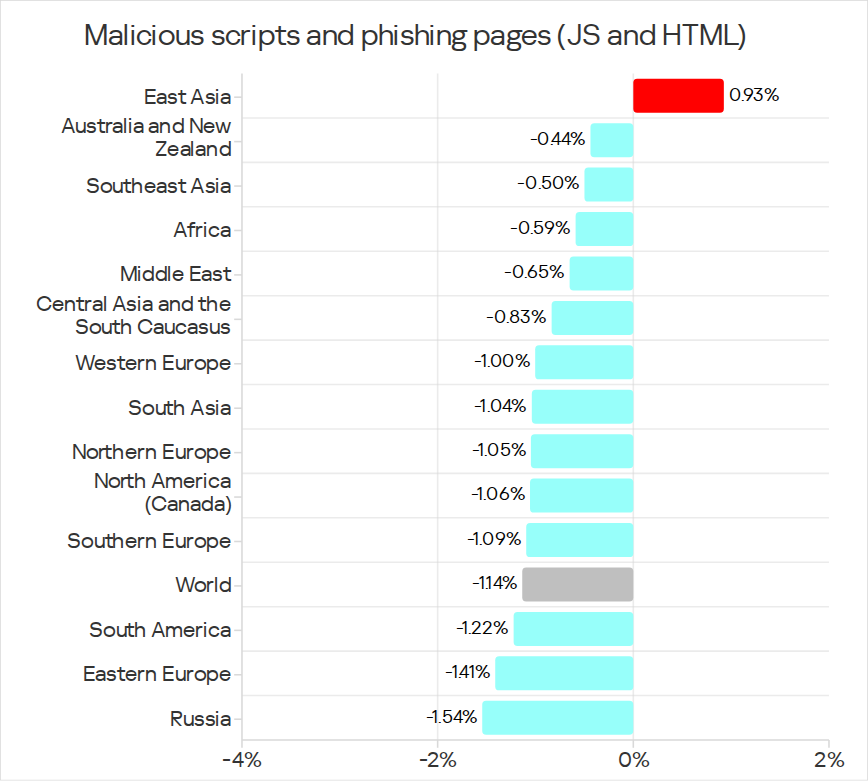
Over the quarter, the percentage figures only increased in East Asia, rising by 0.93 pp to 4.86%. This is the second-highest figure in the region in the last three years.
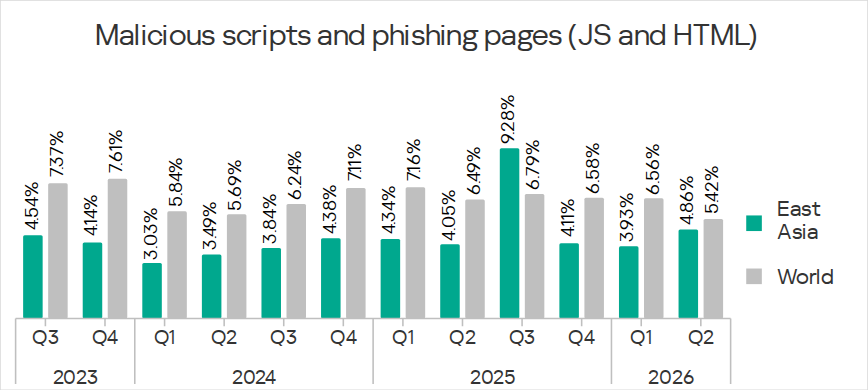
Mongolia had the highest rate of malicious scripts and phishing pages (8.19%) among the countries of East Asia.
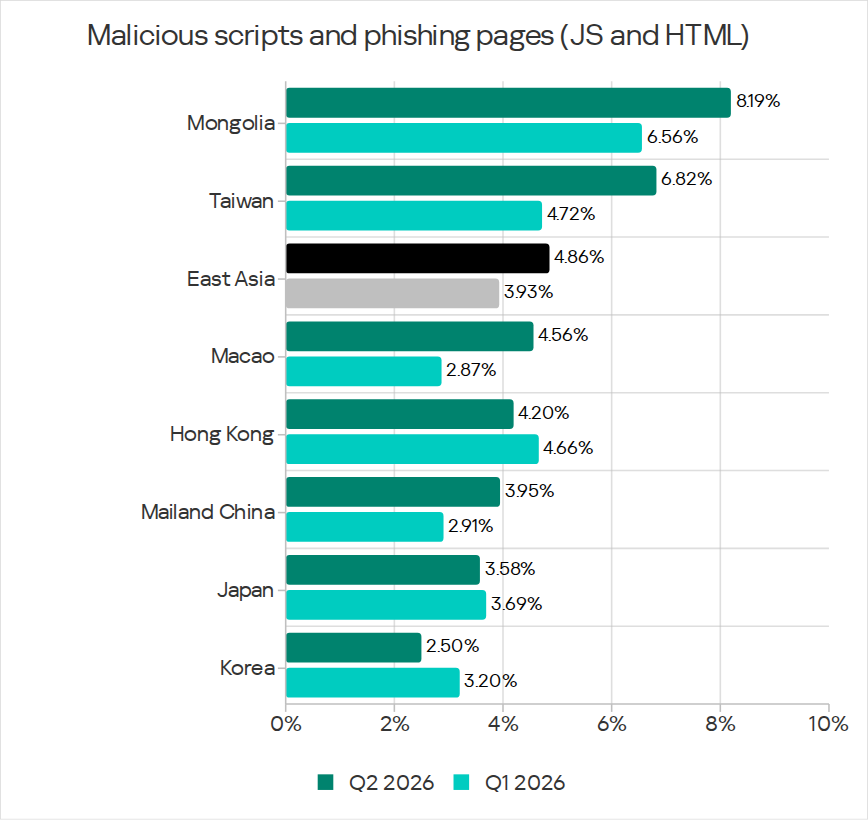
In the region, the percentage of malicious scripts and phishing pages increased in all the industries surveyed, except construction. The highest figures were recorded for biometrics (9.01%) and building automation (6.49%).
On average, biometrics led the ranking among the selected industries in terms of the percentage of ICS computers on which malicious scripts and phishing pages were blocked (13.20%).
Among the selected industries across all regions, the top five for this parameter are:
- Biometrics in Southern Europe – 20.72%;
- Building automation in Southern Europe – 14.91%;
- Biometrics in South America – 13.45%;
- Building automation in Africa – 11.78%;
- Biometrics in Africa – 11.60%.
It is worth noting that the first three positions in the similar ranking for malicious documents are occupied by the same industries in the same regions.
Malicious documents (MSOffice + PDF)
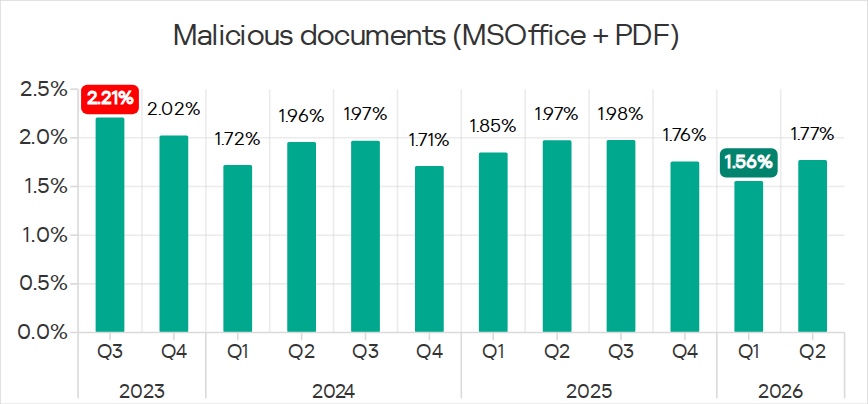
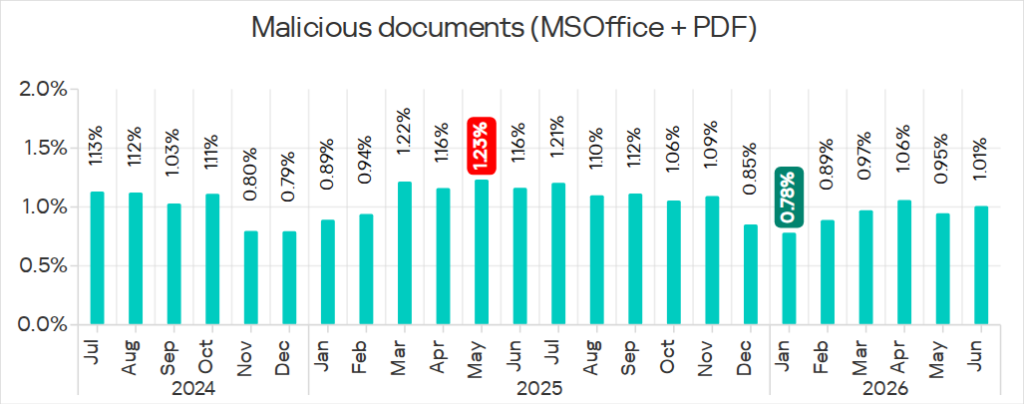
Malicious documents ranked fourth in the threat category ranking by the percentage of ICS computers on which they were blocked. The percentage for this category decreased over the previous three quarters, reaching its lowest level in three years. However, in Q2 2026, it increased to 1.77%.
Malicious documents spread via all threat sources, primarily email clients.
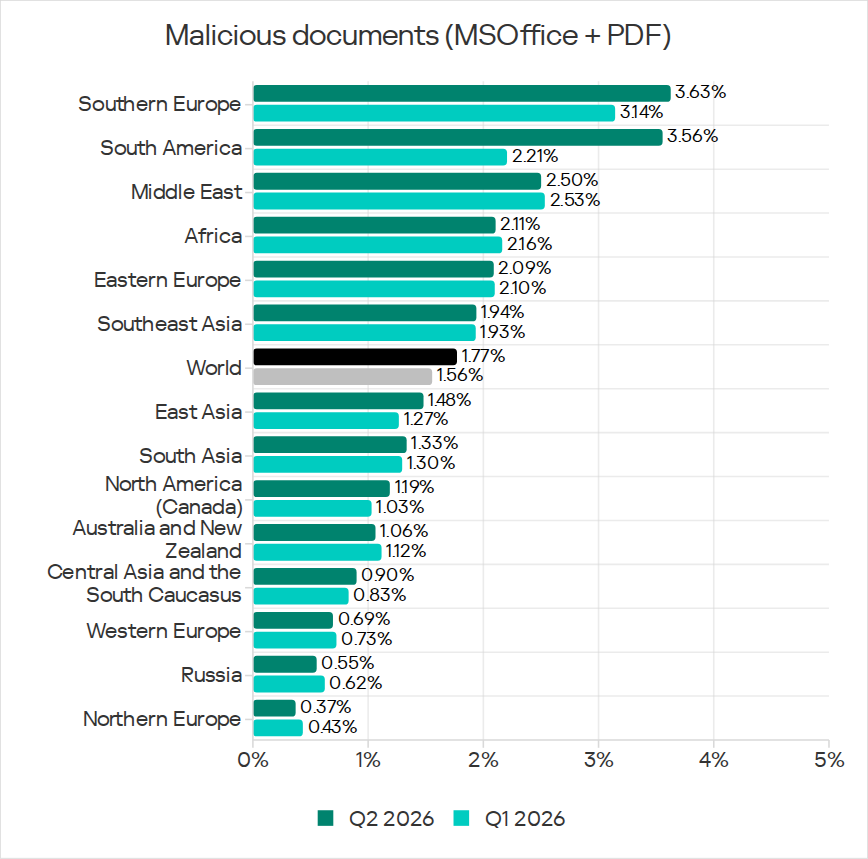
Regionally, the percentage of ICS computers on which malicious documents were blocked ranged from 0.37% in Northern Europe to 3.63% in Southern Europe.
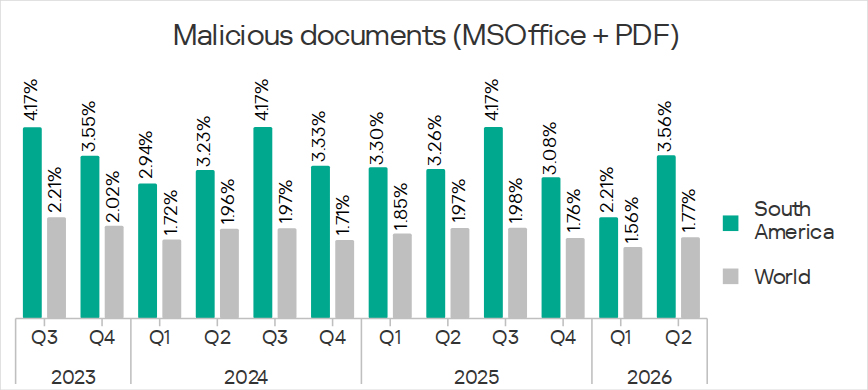
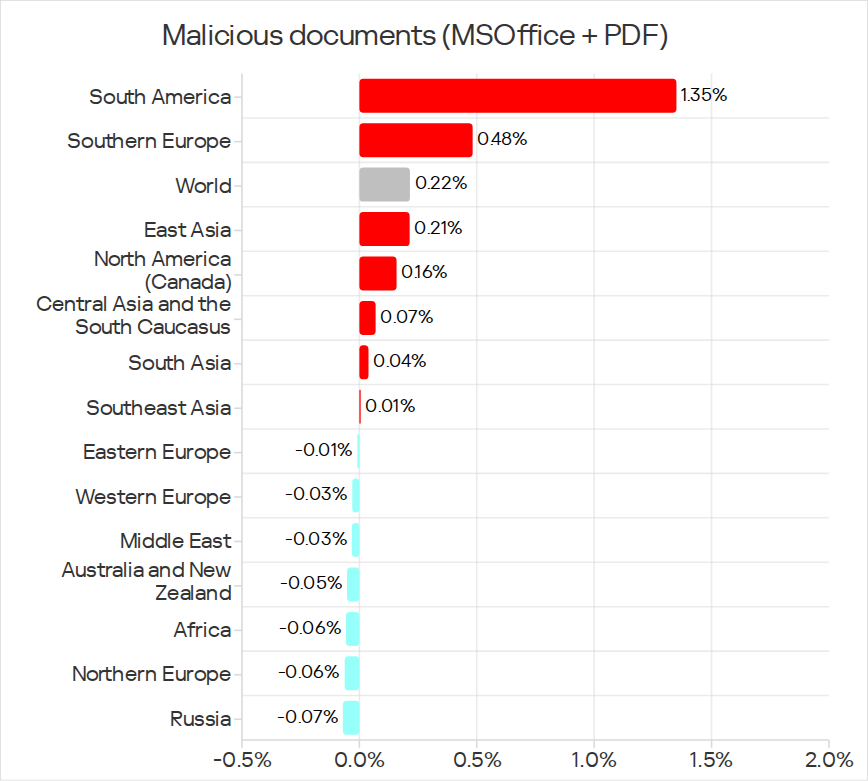
Over the quarter, the percentage figures for malicious documents increased in seven regions, most notably in South America (by 1.35 pp) and Southern Europe (by 0.48 pp). These two regions are among the top three in terms of malicious documents, malicious scripts and phishing pages, as well as threats from email clients.
South America ranked second in the ranking of regions in terms of malicious documents. In Q2 2026, the percentage figure in the region was 3.56%, which was the fourth highest in three years.
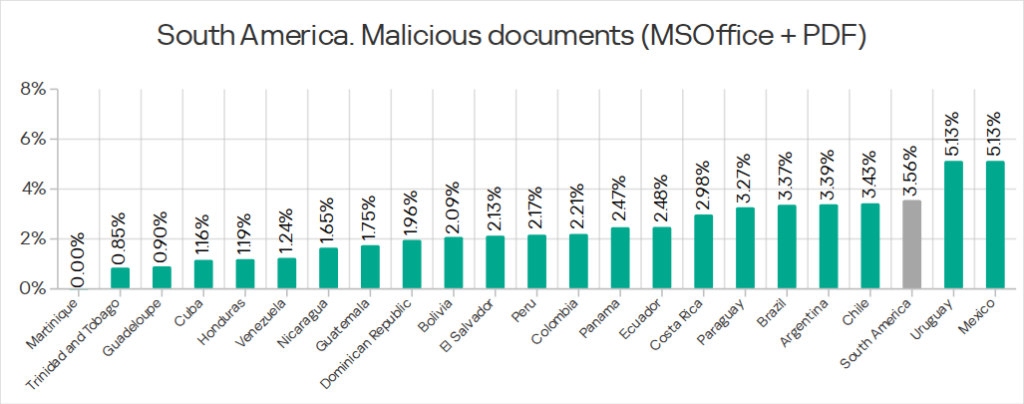
Among the countries in the region, Mexico and Uruguay led the ranking in terms of malicious documents, both with 5.13%.
Among the selected industries in South America, the highest percentage of ICS computers on which malicious documents were blocked was in biometrics (6.67%).
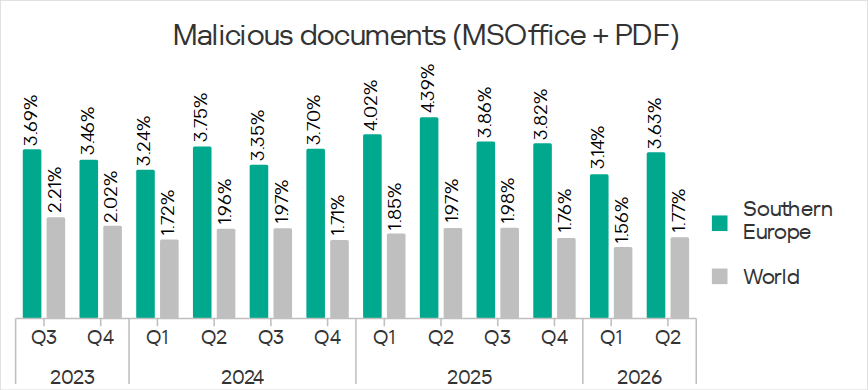
Southern Europe ranked first in the ranking of regions in terms of malicious documents. In the previous quarter, the percentage figure in the region was the lowest in three years, but in Q2 2026 it increased to 3.63%.
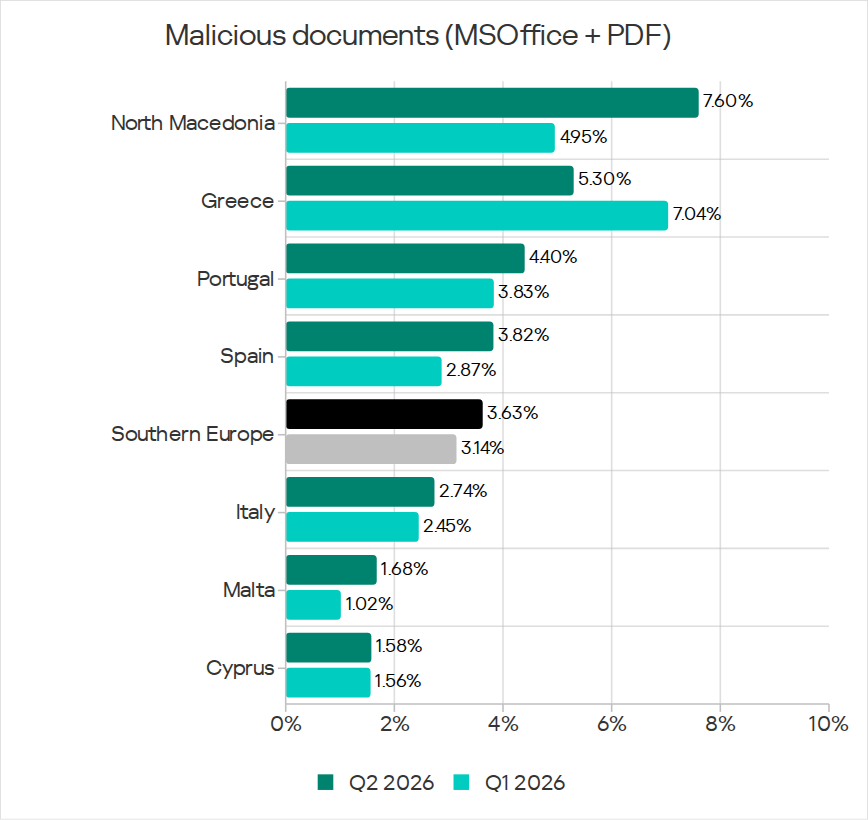
Among the countries in the region, the percentage of ICS computers on which malicious documents were blocked in Q2 2026 increased significantly in North Macedonia, which ranked first in the corresponding ranking.
Among the selected industries in Southern Europe, the highest percentage of ICS computers on which malicious documents were blocked was in biometrics (11.48%).
On average, biometrics led the ranking among the selected industries in terms of the percentage of ICS computers on which malicious documents were blocked (6.03%).
Among the selected industries across all regions, the top five for this parameter are:
- Biometrics in Southern Europe – 11.48%;
- Building automation in Southern Europe – 7.21%;
- Biometrics in South America – 6.67%;
- Building automation in Eastern Europe – 5,14%;
- Building automation in South America – 4.94%.
Note that in the similar ranking for malicious scripts and phishing pages, the first three positions are occupied by the same industries in the same regions.
Two industries from Southern Europe and South America were included in the top five. Recall that these regions are among the three regions with the highest percentage of ICS computers on which threats from email clients were blocked, and email is the main source of malicious documents.
Next-stage malware
Spyware
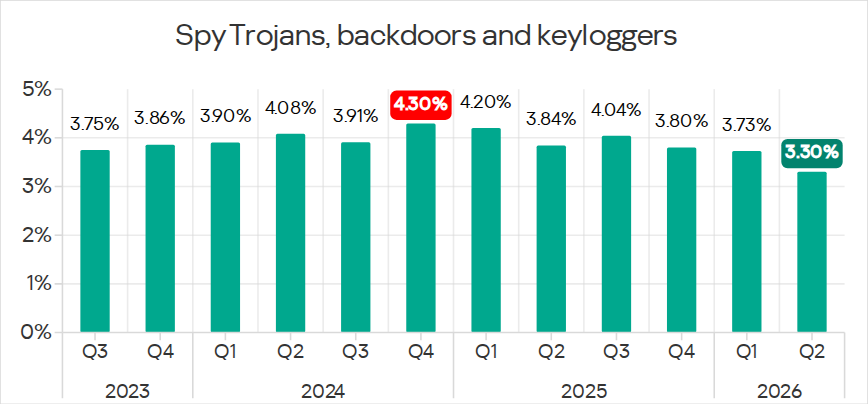
In Q2 2026, spyware ranked third in the threat category ranking based on the percentage of ICS computers on which it was blocked. The percentage for this category (3.30%) is the lowest it has been since 2022.
Spyware spreads via all threat sources, primarily email.
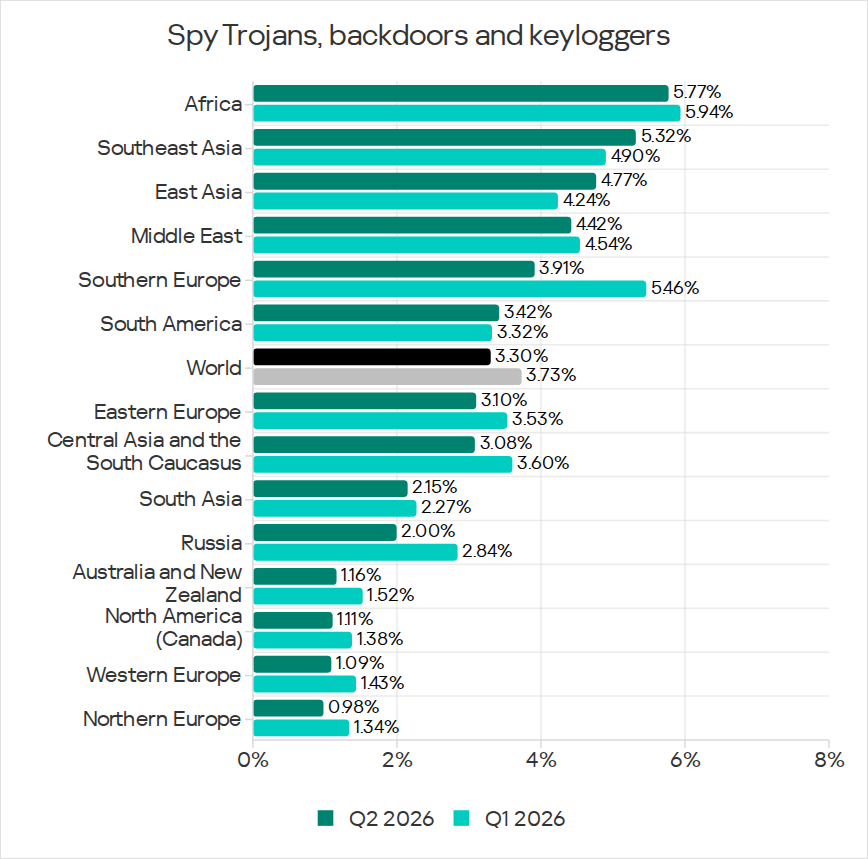
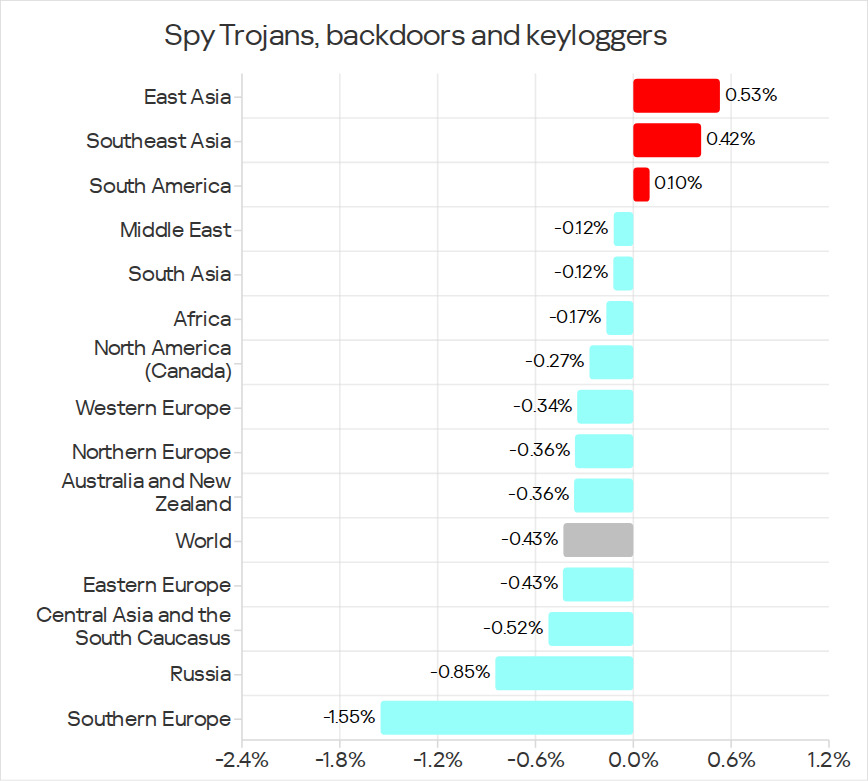
Regionally, the percentage of ICS computers on which spyware was blocked ranged from 0.98% in Northern Europe to 5.77% in Africa. Over the quarter, the percentage figures increased in three regions, most notably in East Asia (by 0.53 pp) and Southeast Asia (by 0.42 pp).
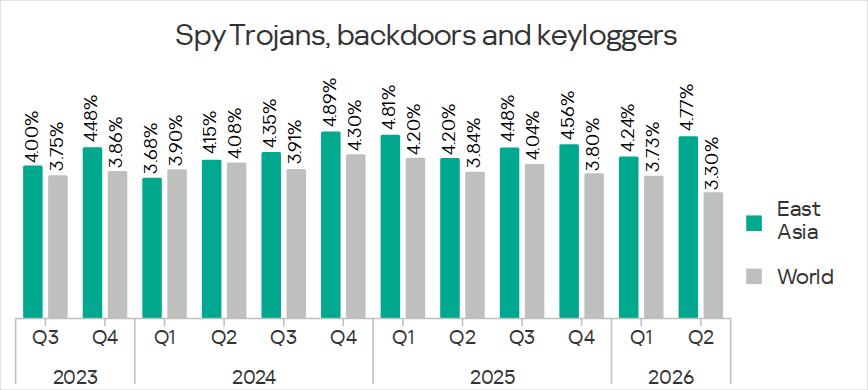
East Asia ranked third based on its percentage figure for spyware (4.77%), behind Africa and Southeast Asia. This is the region’s highest rate since Q2 2025.
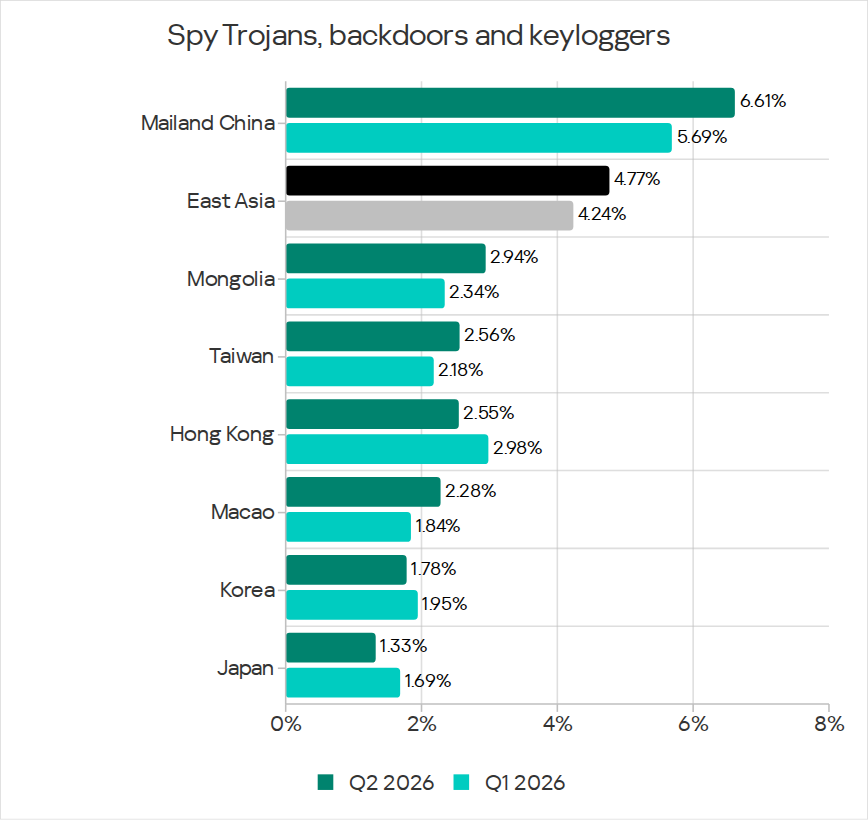
Among the countries in the region, the highest percentage of ICS computers on which spyware was blocked was in mainland China (6.61%).
Among the selected industries in East Asia, the highest percentage figures for spyware were in the electric power (11.75%) and manufacturing (5.87%) industries. In all the industries surveyed, the percentage figures are higher than the regional average.
Note that East Asia was the only region where the percentage of ICS computers on which malicious scripts and phishing pages were blocked increased. The spread of malicious scripts and phishing pages by threat actors often precedes targeted attacks and infection of computers with spyware.
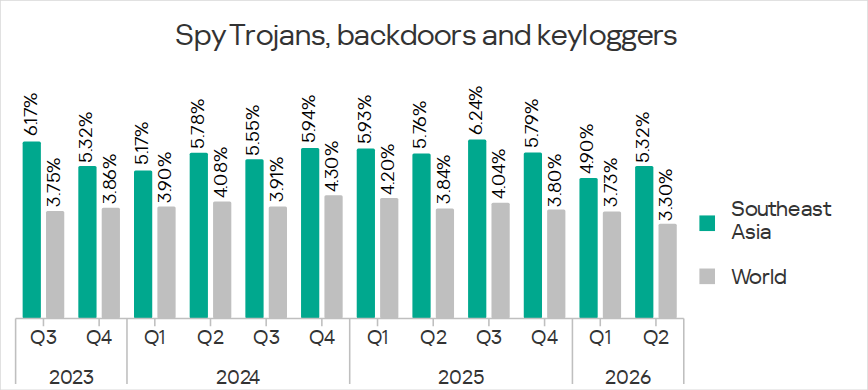
Southeast Asia ranked second after Africa in the ranking of regions in terms of spyware, with 5.32%.
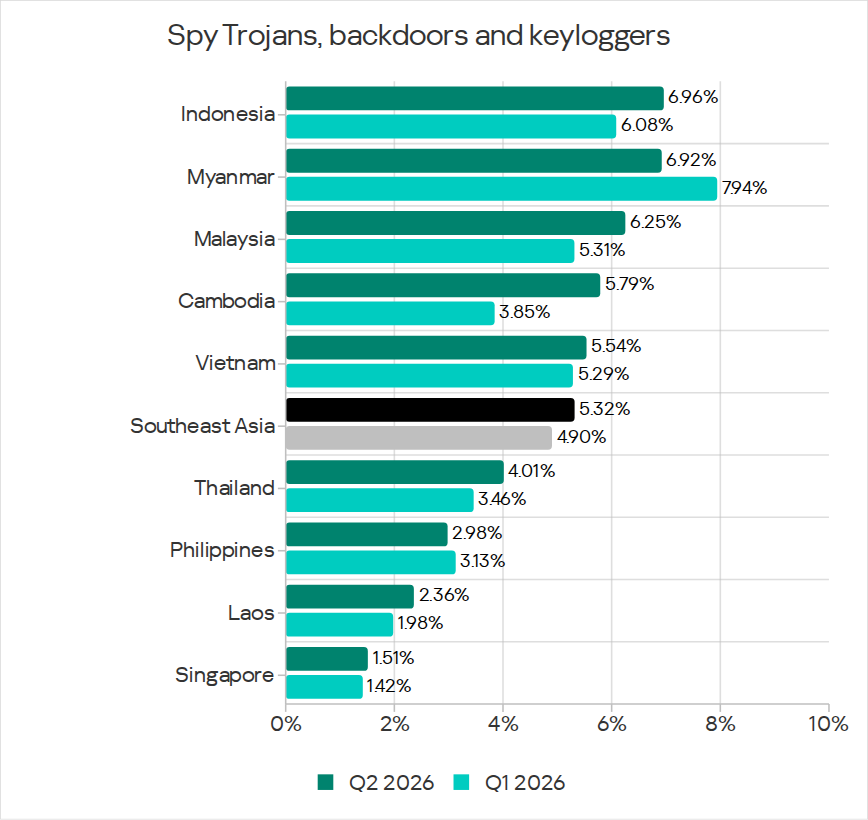
Indonesia (6.96%) and Myanmar (6.92%) lead the way in the region in terms of the percentage of ICS computers on which spyware was blocked.
Among the selected industries in Southeast Asia, the highest percentage figures for spyware were in biometrics (8.93%) and manufacturing (7.32%). The figures increased in all industries over the quarter.
On average, biometrics led the ranking among the selected industries in terms of the percentage of ICS computers on which spyware was blocked (7.29%).
Among the selected industries across all regions, the top five for this parameter are:
- Electric power in East Asia – 11.75%;
- Biometrics in Southern Europe – 11.36%;
- Biometrics in Southeast Asia – 8.93%;
- Biometrics in Africa – 7.71%;
- Building automation in Southern Europe – 7.38%.
Note that two of the top five positions are occupied by industries from Southern Europe, which leads among the regions in terms of malicious documents, malicious scripts and phishing pages, as well as threats from email clients. We reiterate that malicious scripts are sent in email attachments, among other things, and are used to download spyware to computers.
Ransomware
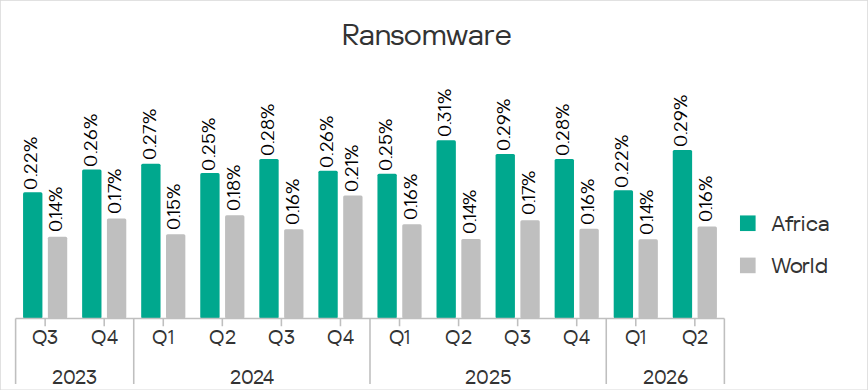
The percentage of ICS computers on which ransomware was blocked decreased in the previous three quarters, but increased to 0.16% in Q2 2026.
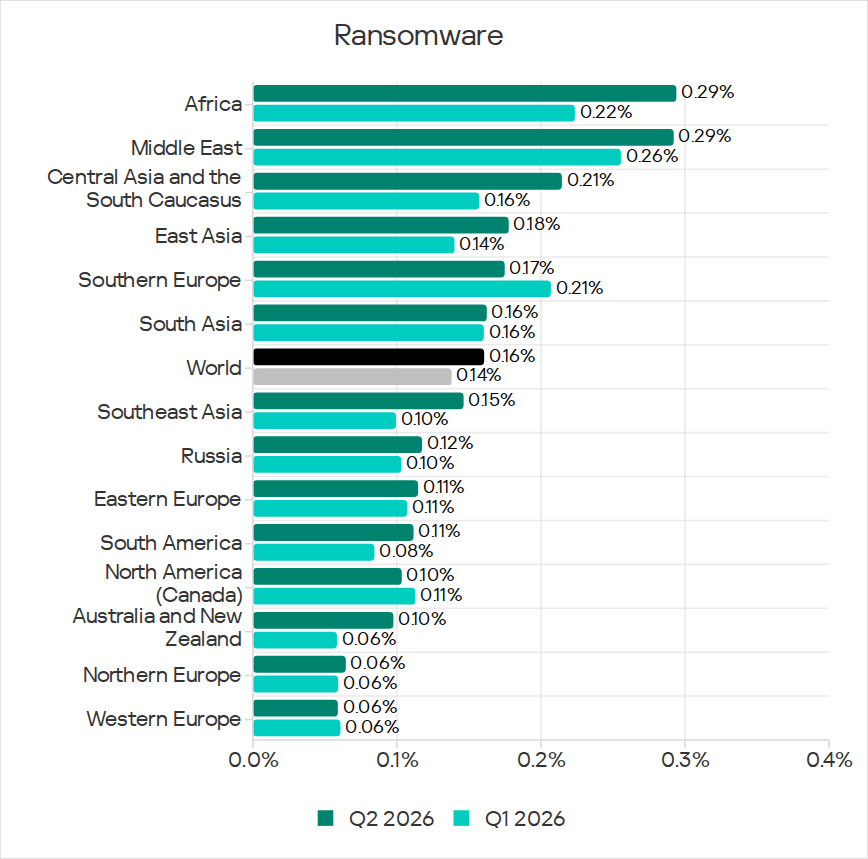
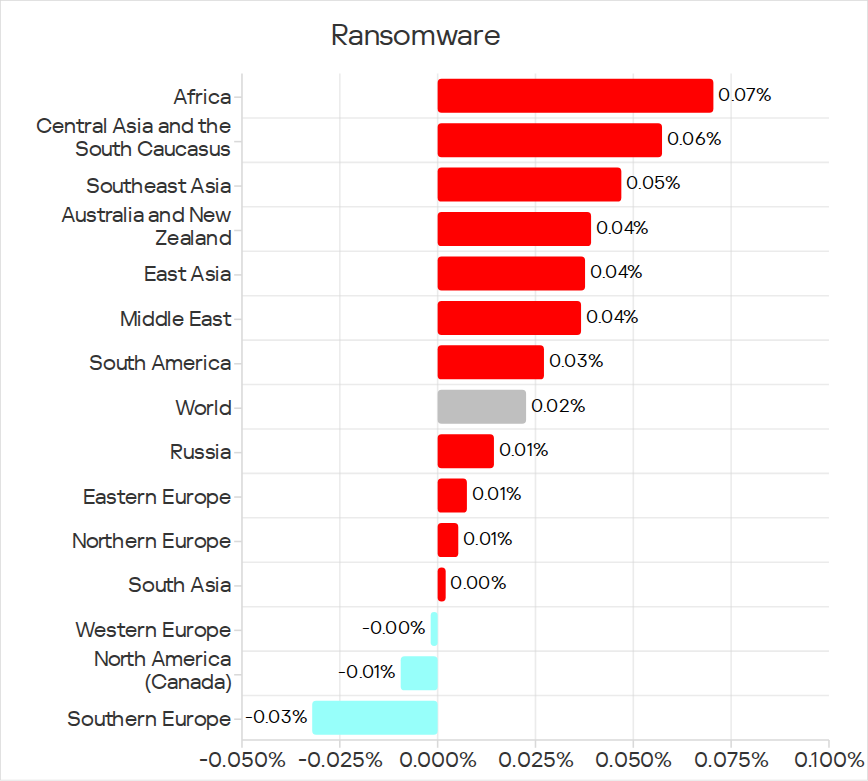
Regionally, the percentage ranged from 0.06% in Western Europe to 0.29% in Africa. During the quarter, the percentage increased in all regions, except Western and Southern Europe and North America (Canada). Africa led the ranking in terms of growth for this parameter.
In Q2 2026, Africa ranked first among the regions in terms of the percentage of ICS computers on which ransomware was blocked (0.29%). The only time the figure was higher in the past three years was in Q2 2025 (0.31%).
In Africa, ransomware spreads via the internet and is also found on removable media.
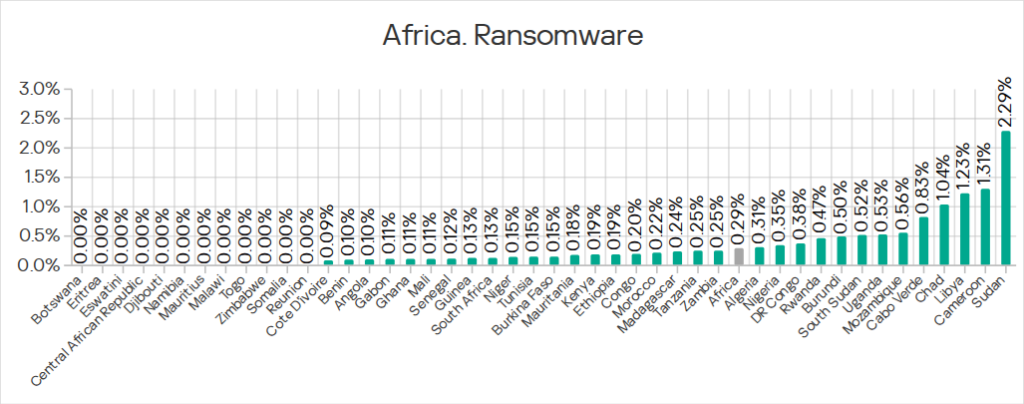
Among the countries in the region, Sudan (2.29%) led by a wide margin in terms of the percentage of ICS computers on which ransomware was blocked.
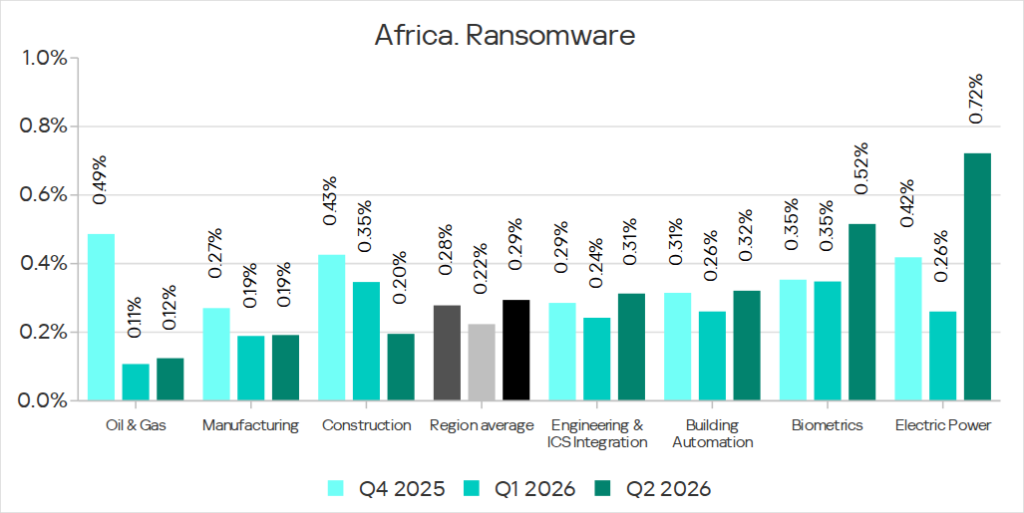
Among the selected industries in Africa, the highest percentage figures for ransomware were in the electric power industry (0.72%) and biometrics (0.52%). Over the quarter, the figures increased in all industries, except manufacturing and construction. The biggest increase was recorded in the electric power industry.
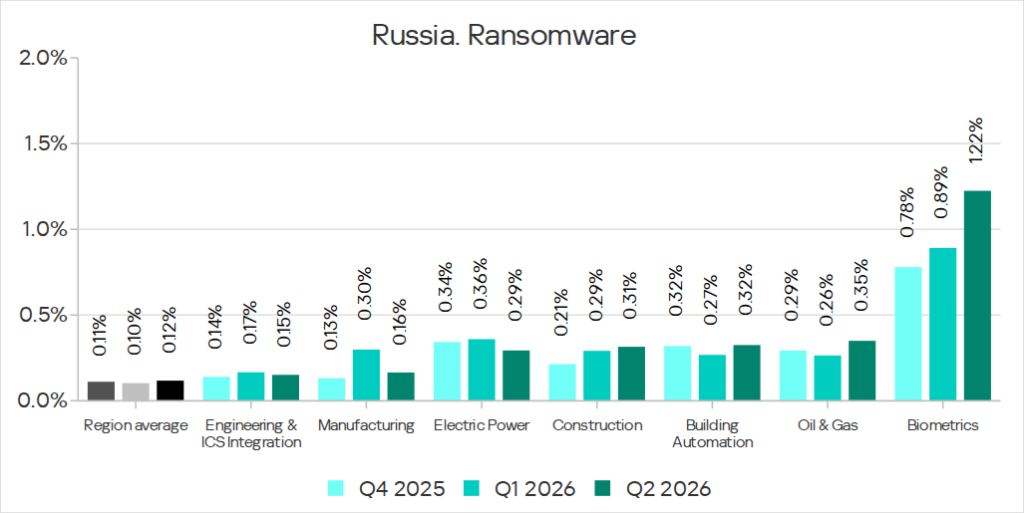
In Russia, the percentage of ICS computers on which ransomware was blocked in biometric systems has increased for three consecutive quarters, reaching 1.22%. This is the highest level of ransomware across all industries in all regions.
On average, biometrics led the ranking among the selected industries in terms of the percentage of ICS computers on which ransomware was blocked (0.31%).
Among the selected industries across all regions, the top five for this parameter are:
- Biometrics in Russia – 1.22%;
- Electric power in Africa – 0.72%;
- Biometrics in Western Europe – 0.59%;
- Biometrics in the Middle East – 0.57%;
- Electric power in East Asia – 0.56%.
Miners
In Q2 2026, the percentage of ICS computers on which miners were blocked was the lowest since 2021, for both categories of miner: miners in the form of executable files for Windows (0.48%) and web miners running in browsers (0.14%).
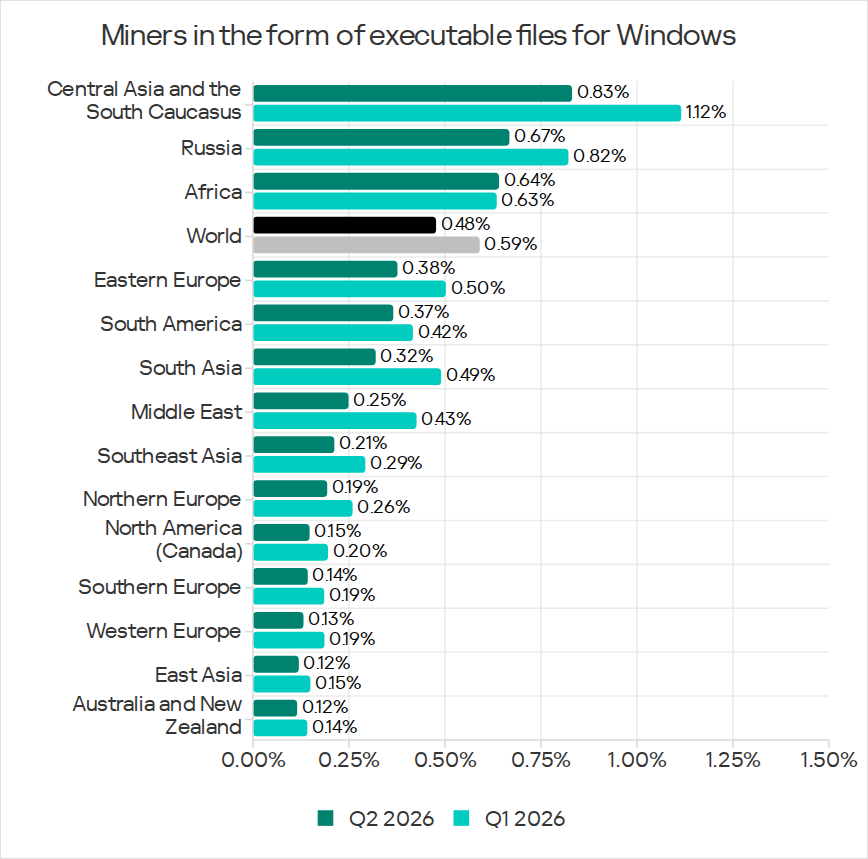
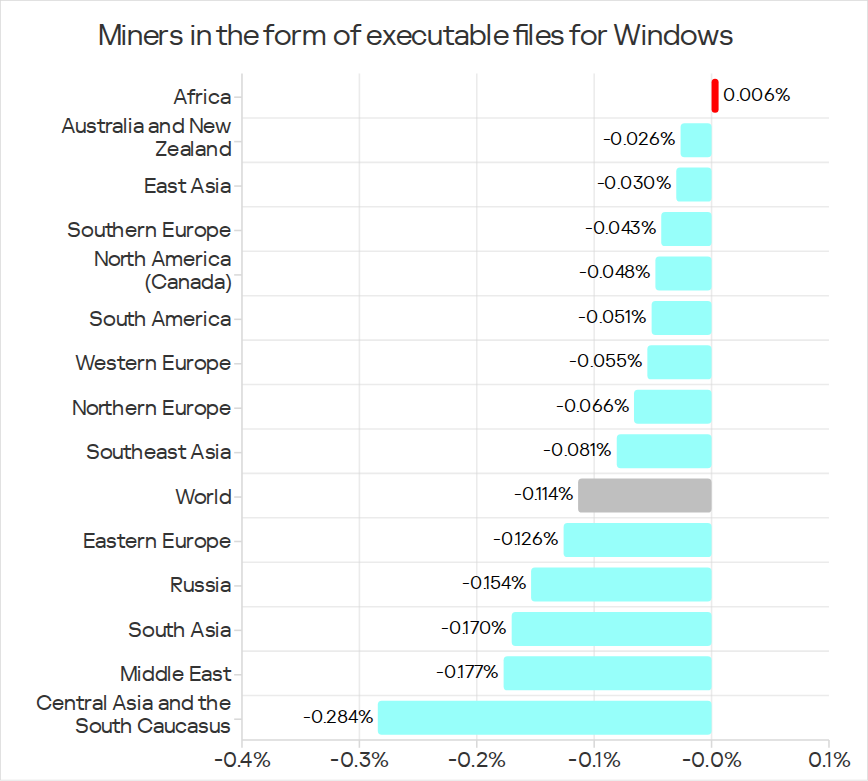
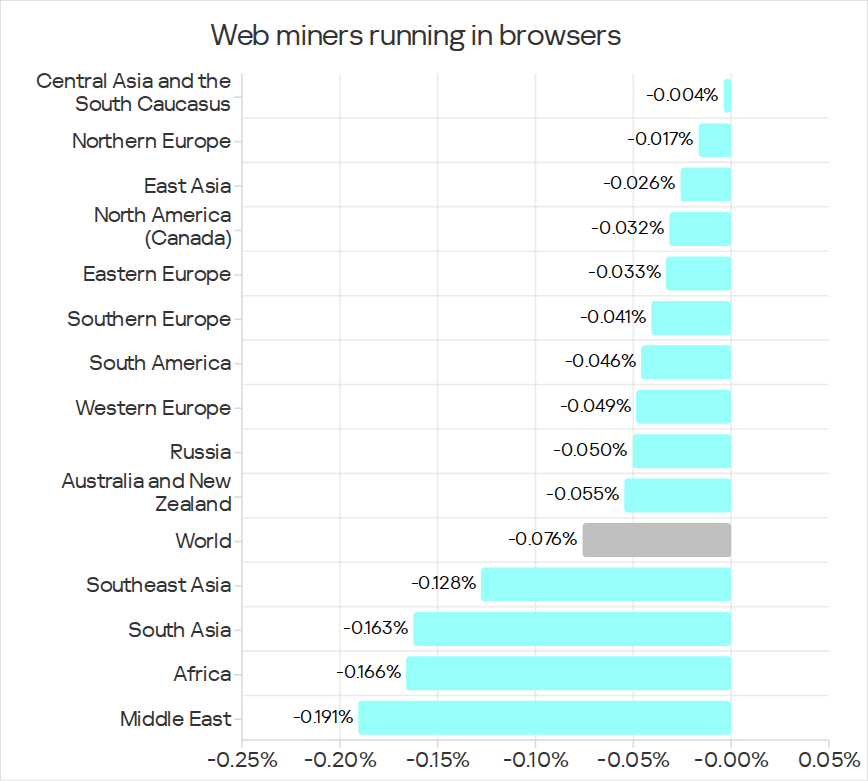
The figures for both categories decreased in all regions, except miners in the form of executable files for Windows in Africa, where it increased slightly.
Miners in the form of executable files for Windows
Regionally, the percentage ranged from 0.12% in Australia and New Zealand to 0.83% in Central Asia and the South Caucasus. Russia still ranks second (0.67%).
This category of threat spreads through all threat sources, most often via the internet.
On average, the oil and gas industry led the ranking among the selected industries in terms of the percentage of ICS computers on which miners in the form of executable files for Windows were blocked (0.66%).
Among the selected industries across all regions, the top five for this parameter include four industries in Central Asia and the South Caucasus: biometrics (2.05%), manufacturing (1.66%), construction (1.36%), and electric power (1.27%). Biometrics in Russia ranked third in this list (1.47%).
Web miners
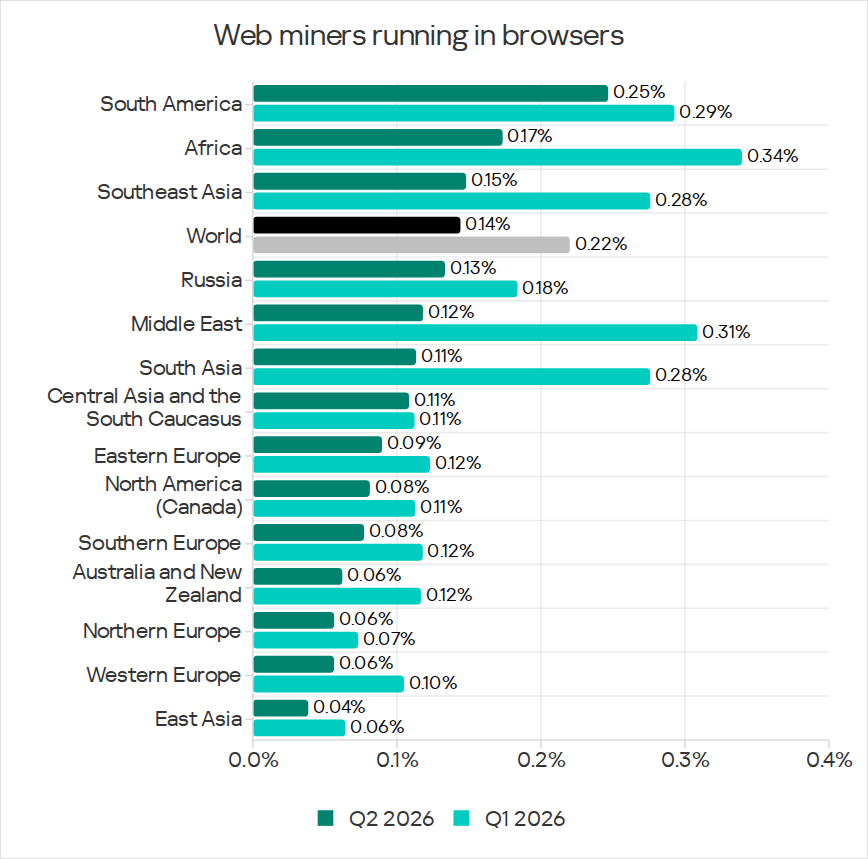
The figures for web miners across the regions range from 0.04% in East Asia to 0.25% in South America.
On average, the oil and gas industry led the ranking among the selected industries in terms of the percentage of ICS computers on which web miners were blocked (0.34%).
Among the selected industries across all regions, the top five for this parameter are:
- Biometrics in Russia – 0.90%;
- Manufacturing in Central Asia and the South Caucasus – 0.66%;
- Electric power in Australia and New Zealand – 0.62%;
- Manufacturing in Northern Europe – 0.54%;
- Construction in South America – 0.45%.
Self-propagating malware
Worms
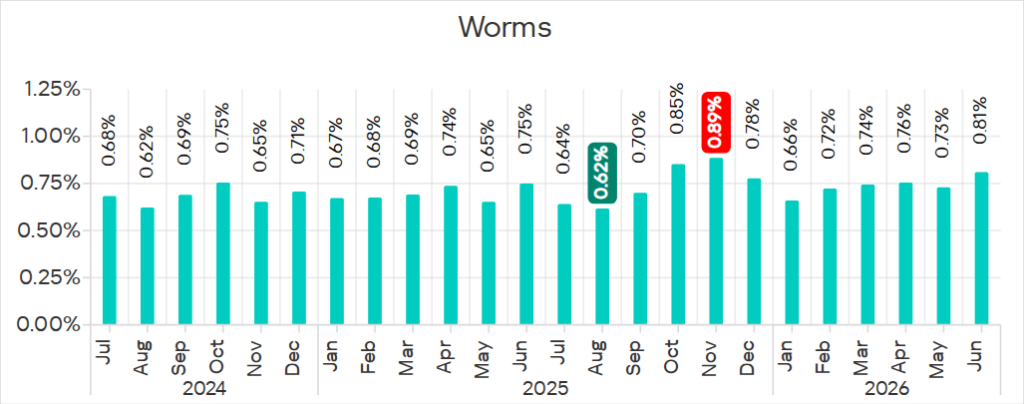
In Q2 2026, the percentage of ICS computers on which worms were blocked increased to 1.43%.
This threat spreads via all sources, with email being actively exploited.
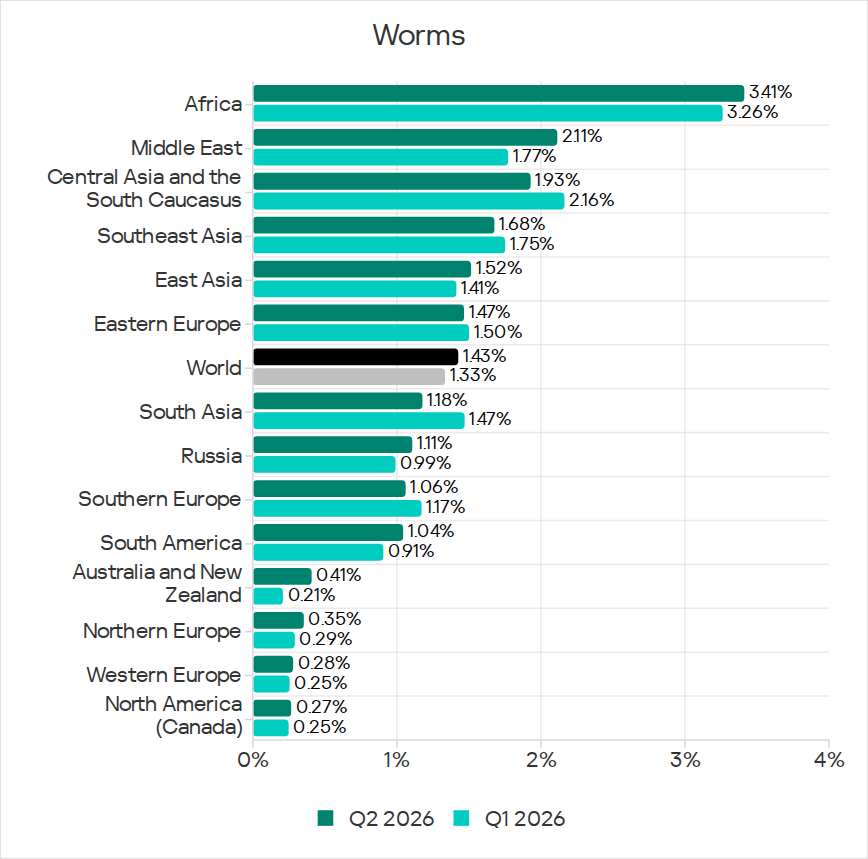
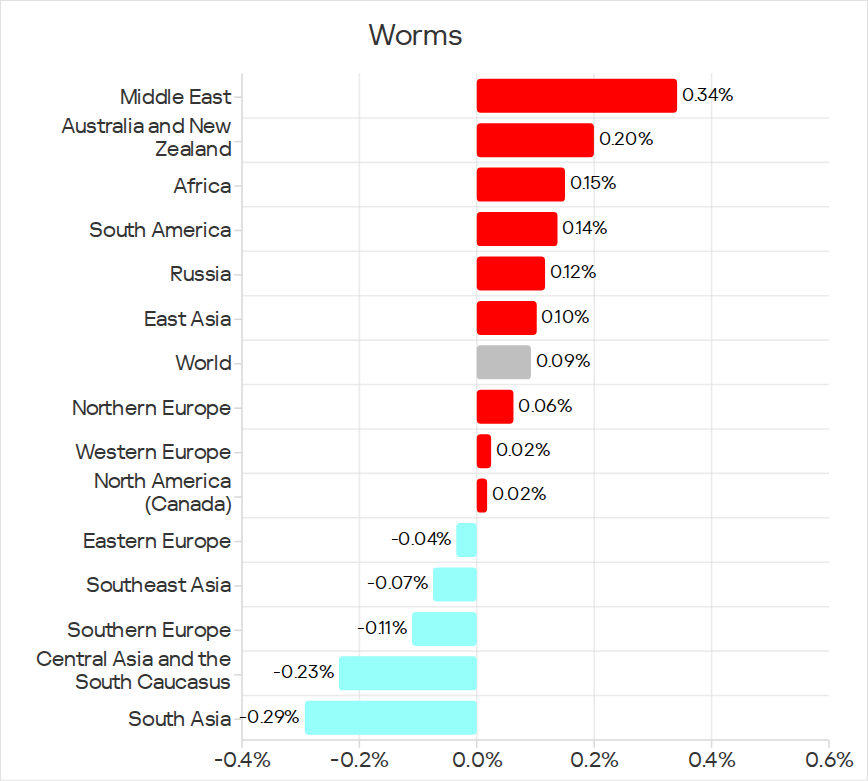
Regionally, the percentage ranged from 0.27% in North America (Canada) to 3.41% in Africa. During the quarter, the figure increased most in the Middle East (by 0.34 pp) and in Australia and New Zealand (by 0.20 pp).
In Q2 2026, the Middle East (2.11%) ranked second (after Africa) in the ranking of regions in terms of worms, displacing Central Asia and the South Caucasus.
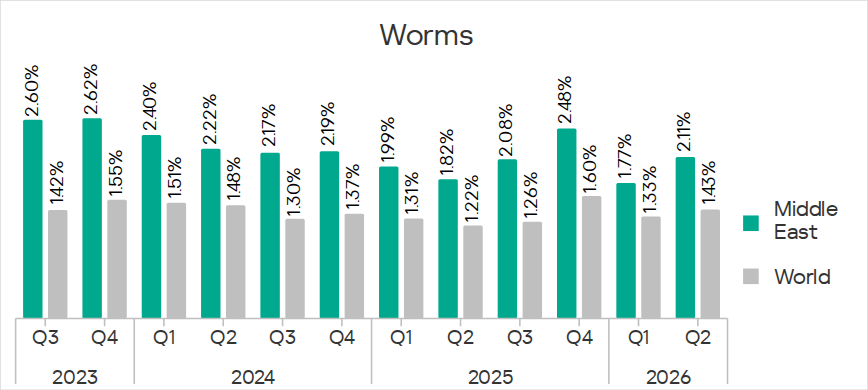
Yemen led the Middle East region in terms of the percentage of ICS computers on which worms were blocked (5.75%).
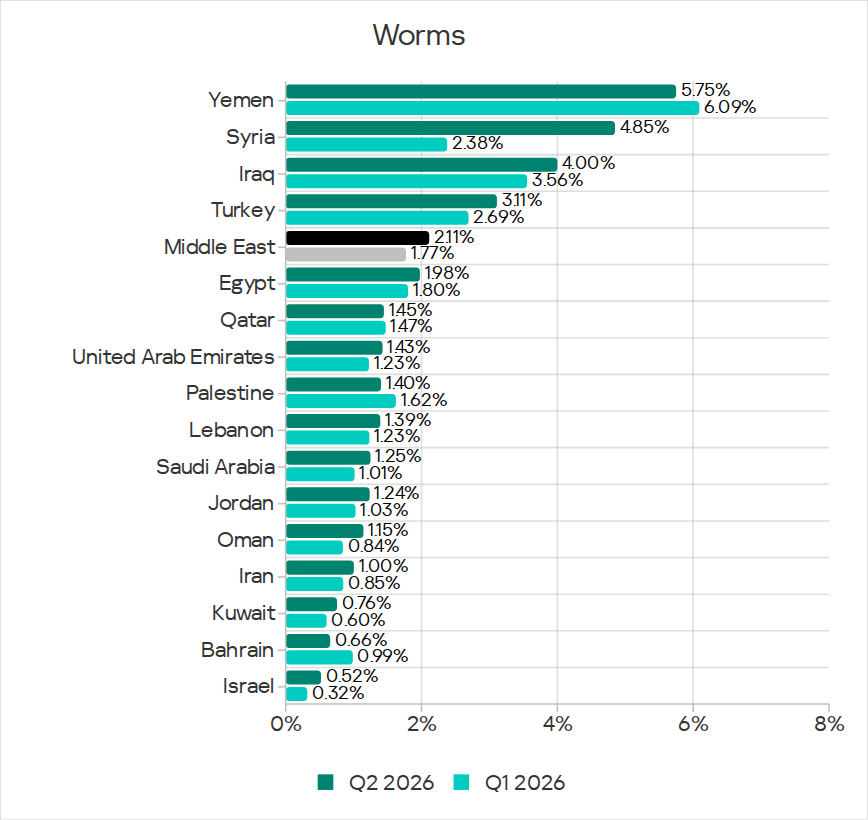
Among the selected industries in the Middle East, the highest percentage of ICS computers on which worms were blocked was in building automation (2.90%). Over the quarter, the figures increased in all industries.
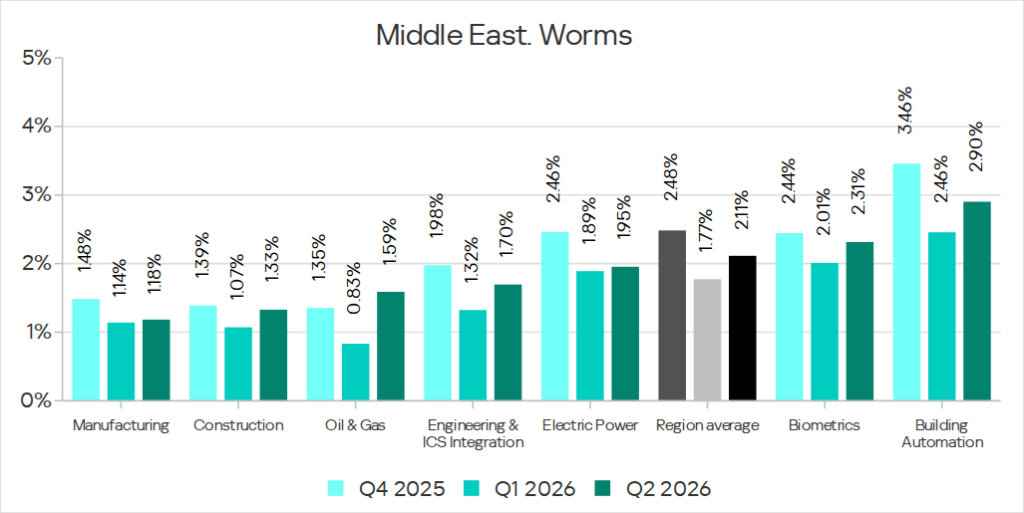
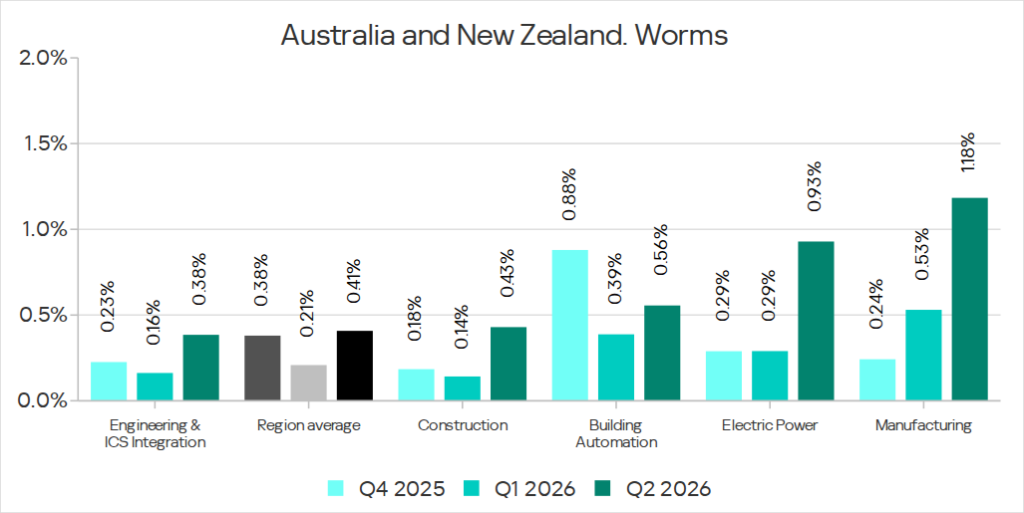
Australia and New Zealand ranked 12th among the regions in terms of the percentage of ICS computers on which worms were blocked (0.41%). Over the past three years, the figure in this region has only been higher in Q2 2024 (0.42%).
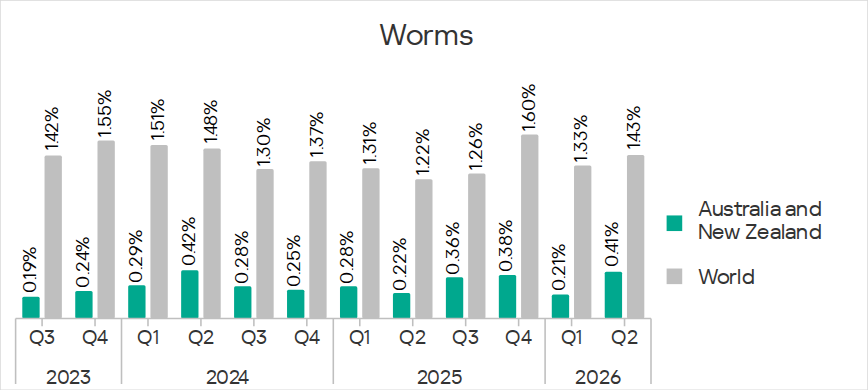
The figures for worms increased in all the surveyed industries in the region, most notably in manufacturing and electric power. As a result, the figures for these industries exceeded the regional average by 2.9 and 2.3 times, respectively.
On average, biometrics led the ranking among the selected industries in terms of the percentage of ICS computers on which worms were blocked (2.29%).
Among the selected industries across all regions, the top five for this parameter are:
- Electric power in Africa – 4.09%;
- Biometrics in Africa – 3.81%;
- Biometrics in Central Asia and the South Caucasus – 3.51%;
- Engineering and ICS integration in Africa – 3.26%;
- Construction in Africa – 3.19%.
Africa is a long-standing leader among the regions in terms of the percentage of ICS computers on which worms were blocked, as well as in terms of threats from removable media.
Viruses
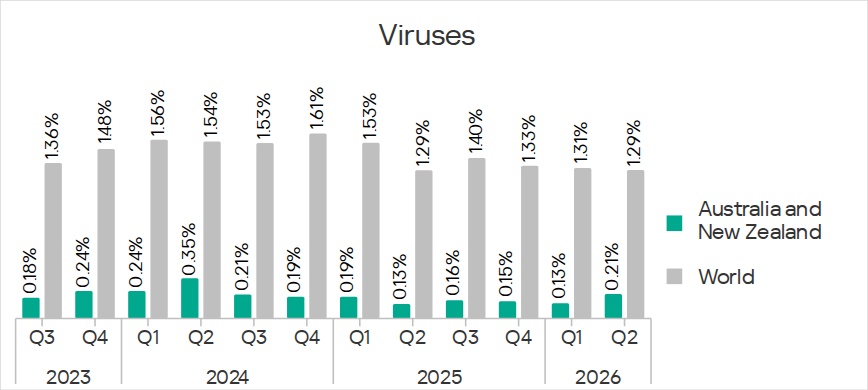
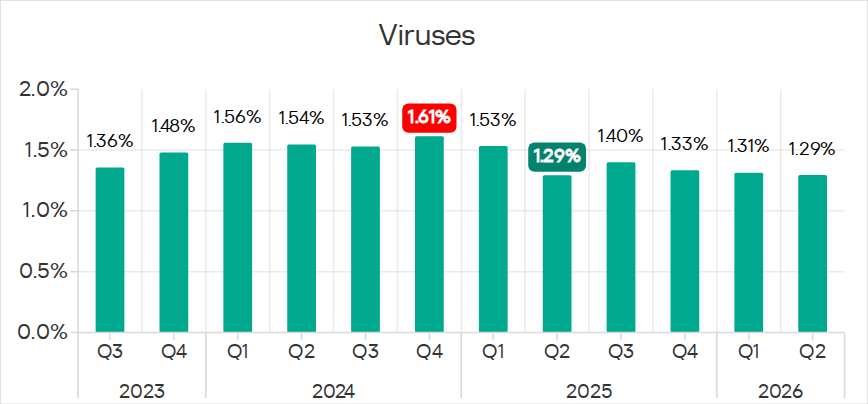
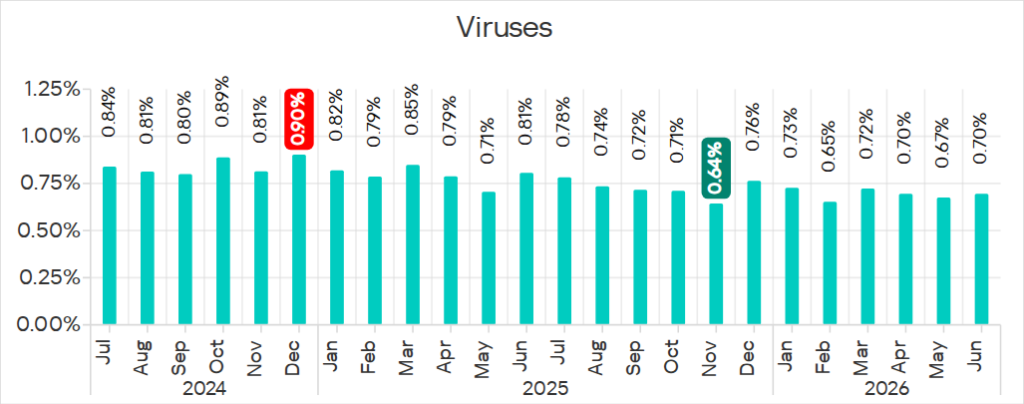
In Q2 2026, the percentage of ICS computers on which viruses were blocked decreased to 1.29%.
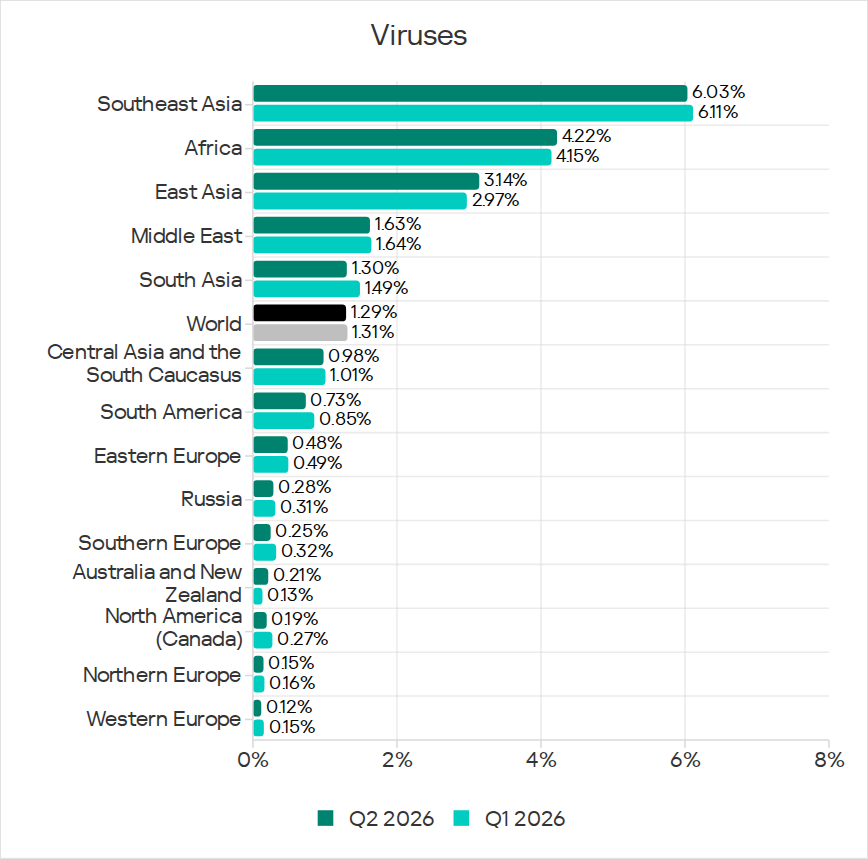
Regionally, the percentage ranged from 0.12% in Western Europe to 6.03% in Southeast Asia. The top three regions for this parameter remain unchanged: Southeast Asia (well ahead of the other regions), Africa, and East Asia. These same regions feature in the list of leaders in terms of malware for AutoCAD.
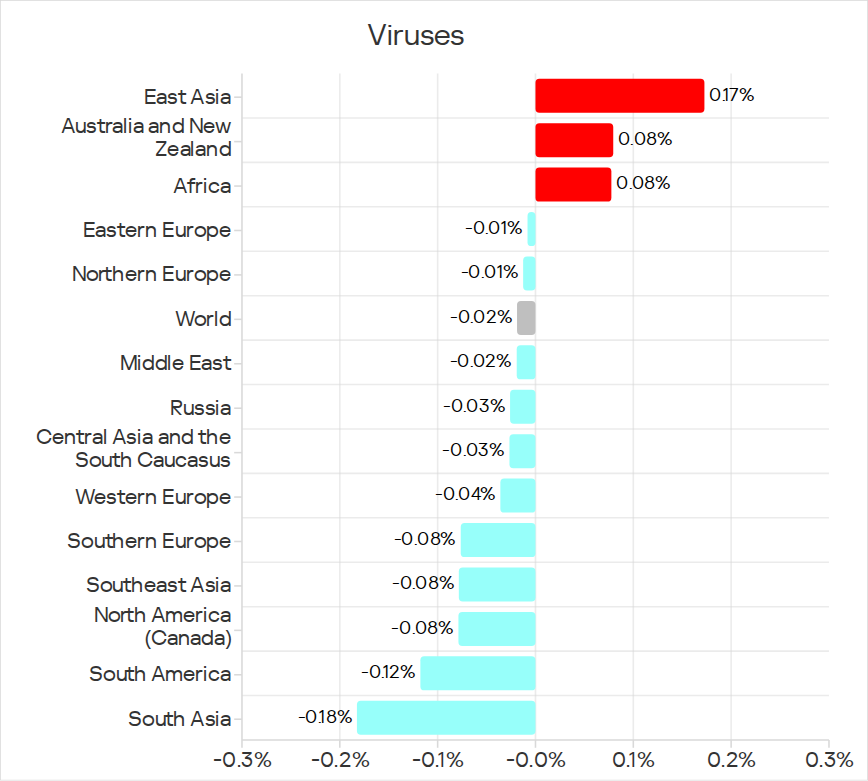
The percentage figures increased in three regions: East Asia, Australia and New Zealand, and Africa.
Africa ranked second in the ranking of regions in terms of the percentage of ICS computers on which viruses were blocked. The figure for this region has increased for the fourth consecutive quarter and reached its highest value since 2022 (4.22%).
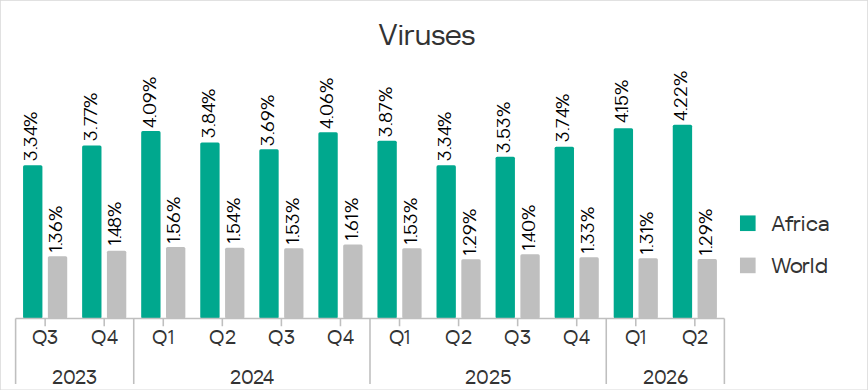
Among the countries of the region, Cameroon (9.46%) and Algeria (7.12%) lead the way in terms of viruses.
Among the selected industries in Africa, the highest percentage of ICS computers on which viruses were blocked was in construction (5.47%).
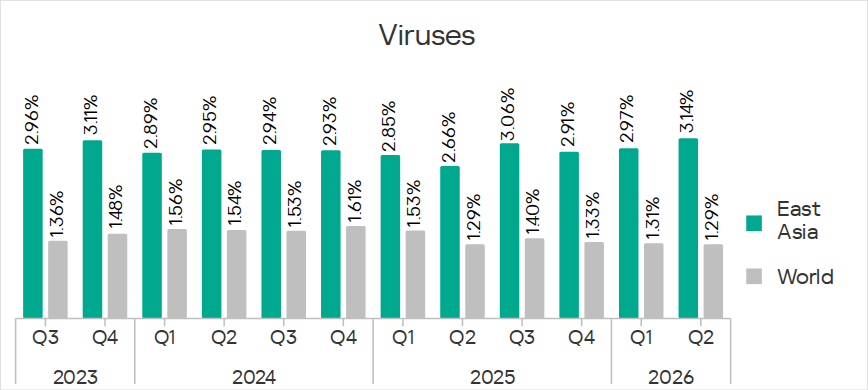
East Asia ranked third among the regions in terms of viruses, reaching the highest level in the region for the past three years at 3.14%.
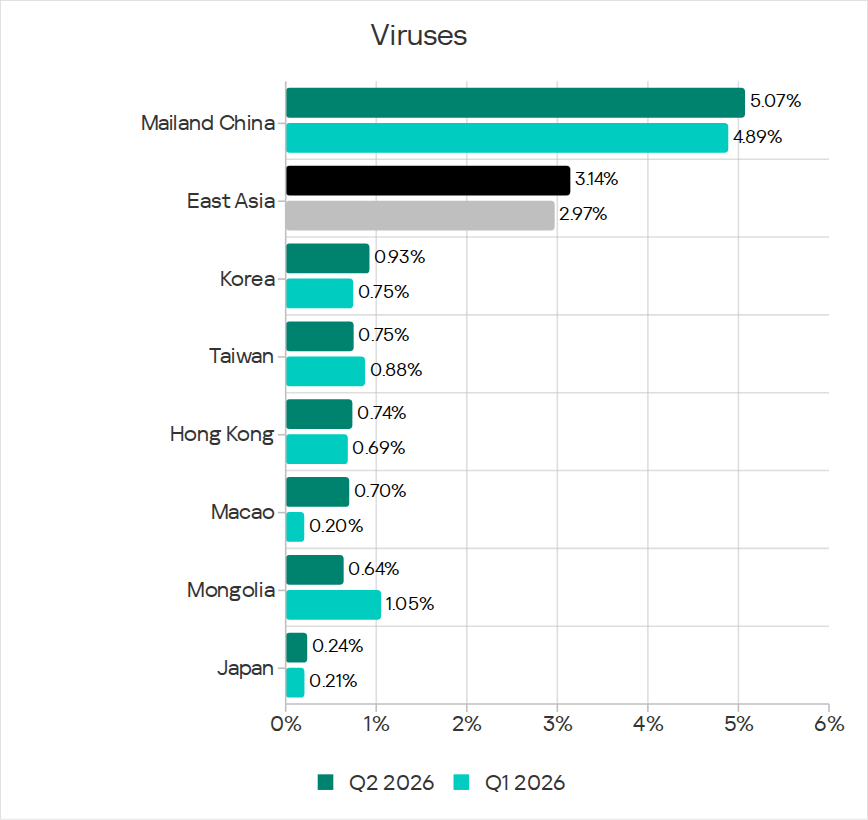
Among the countries and administrative regions of East Asia, mainland China is the clear leader in terms of viruses (5.07%). Note that it also ranked first in terms of malware for AutoCAD.
Among the selected industries in East Asia, the highest percentage of ICS computers on which viruses were blocked was in construction (5.93%).
In Australia and New Zealand, the increase in the percentage of ICS computers on which viruses were blocked was primarily due to a 4.3-fold increase in the figure for the electric power industry – from 0.29% to 1.24%. For a region where the percentage of attacked ICS computers for all threats is 0.12%, this is a very high value.
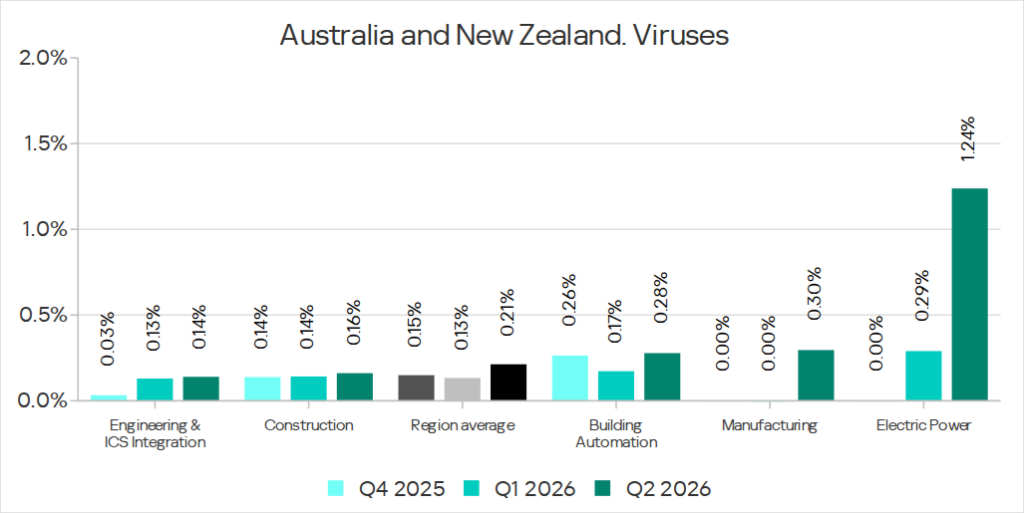
On average, the construction industry led the ranking among the selected industries in terms of the percentage of ICS computers on which viruses were blocked (2.03%).
Among the selected industries across all regions, the top five for this parameter include the construction industry, occupying first place in three regions, while Southeast Asian industries also occupy three places in the list:
- Construction in Southeast Asia – 6.77%;
- Construction in East Asia – 5.93%;
- Construction in Africa – 5,47%;
- Building automation in Southeast Asia – 5.35%;
- Electric power in Southeast Asia – 5.07%.
Malware for AutoCAD
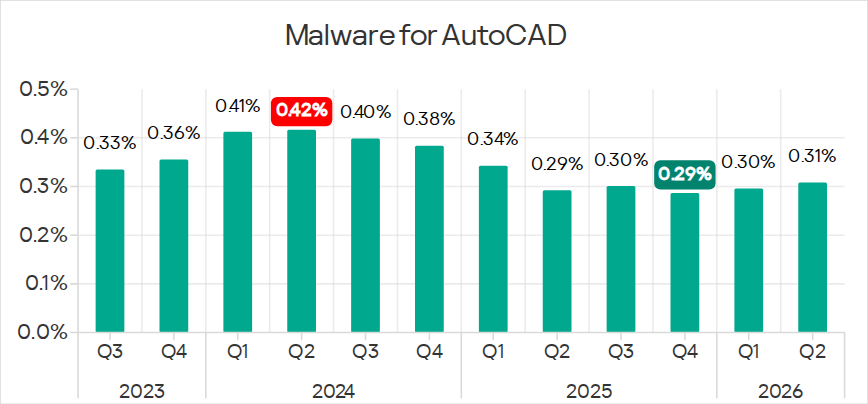
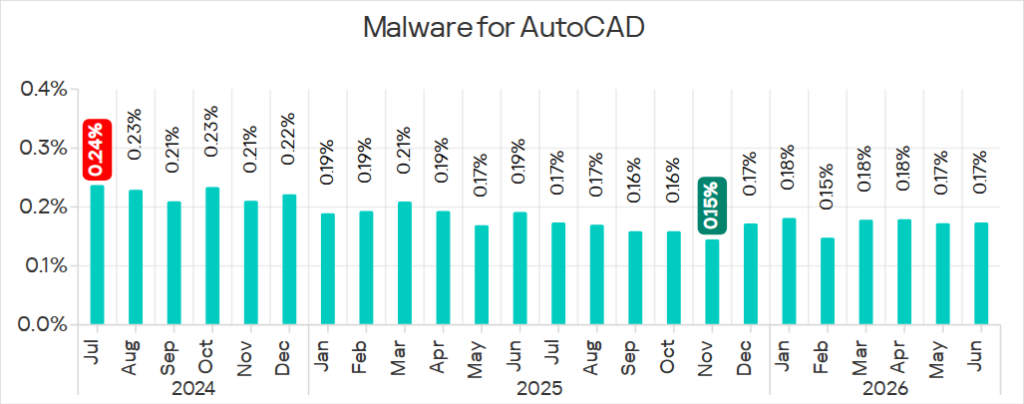
In Q2 2026, the percentage of ICS computers on which malware for AutoCAD was blocked increased to 0.31%.
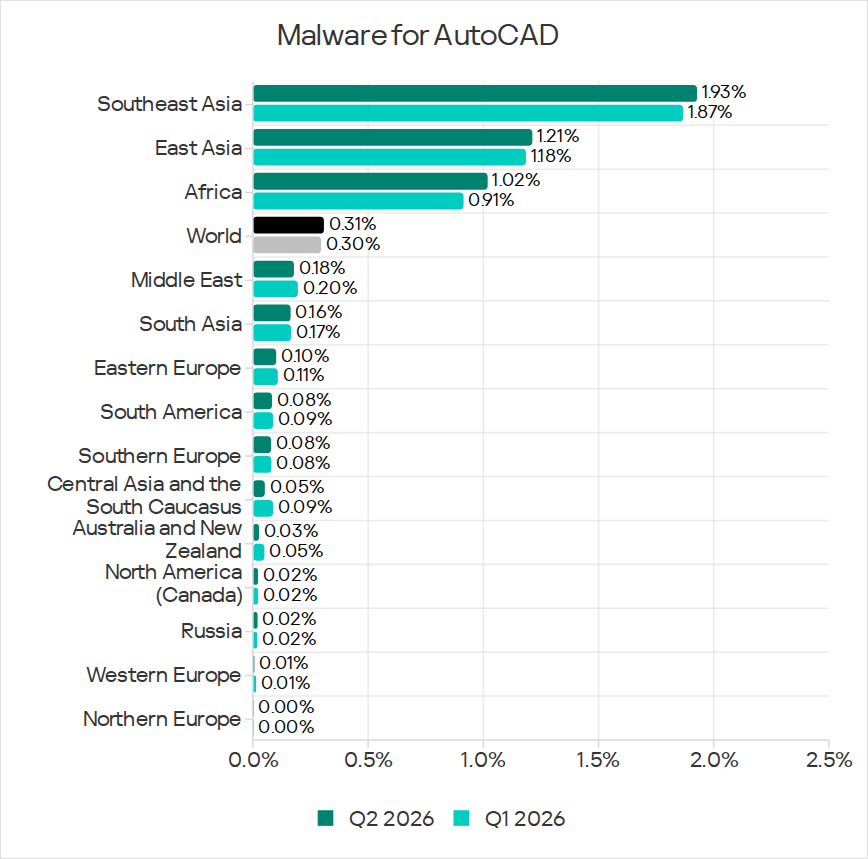
Regionally, the percentage ranged from almost 0% in Northern Europe to 1.93% in Southeast Asia, which leads the other regions by a wide margin. Second and third places in this ranking were occupied by the same regions as the virus ranking: Africa and East Asia.
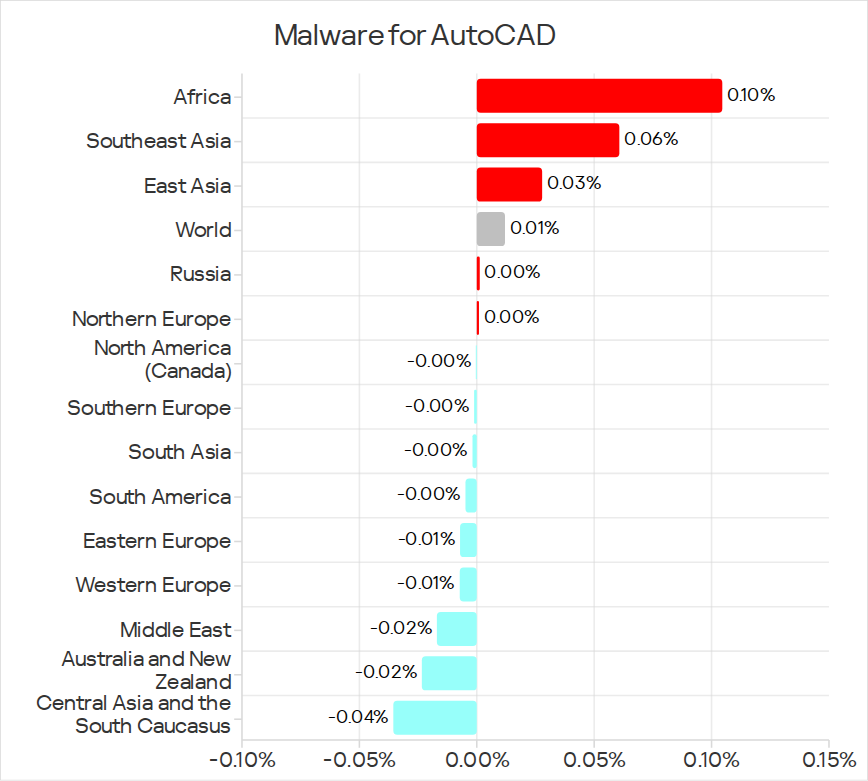
The most notable increase over the quarter was observed in Africa. After more than doubling in the previous quarter, the figure for the region continued to rise (although not so dramatically), reaching 1.02%.
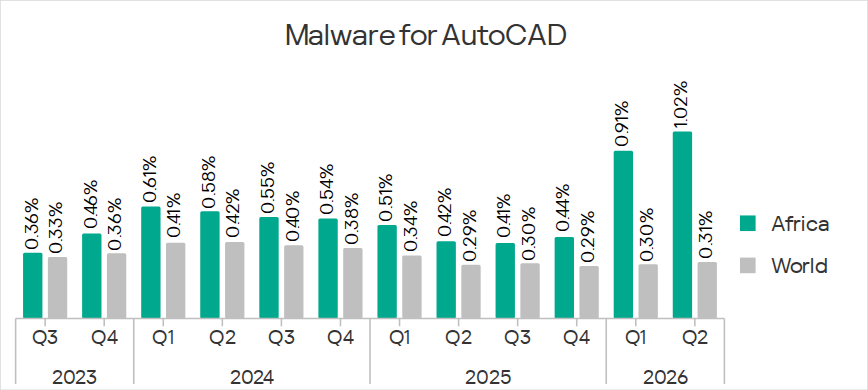
Among African countries, Ethiopia, Algeria, and Morocco led in terms of the percentage of ICS computers on which malware for AutoCAD was blocked, with unusually high figures for this threat category (more than 2%).
Among the selected industries in Africa, the highest percentage of ICS computers on which malware for AutoCAD was blocked, as well as viruses, was in the construction industry (2.08%).
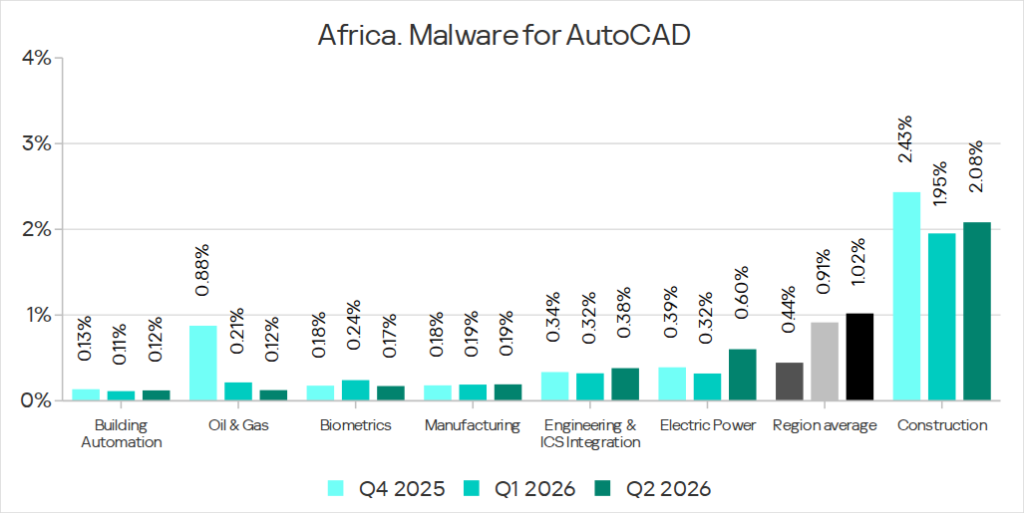
On average, the construction industry led the ranking among the selected industries in terms of the percentage of ICS computers on which malware for AutoCAD was blocked (1.17%).
Among the selected industries across all regions, the top five for this parameter are:
- Construction in East Asia – 6.38% (!);
- Construction in Southeast Asia – 4.05%;
- Construction in Africa – 2.08%;
- Electric power in East Asia – 1.84%;
- Engineering and ICS integration in East Asia – 1.33%.
Main threat sources
In Q2 2026, of all the threat sources, the percentage increased only for email clients.
Internet
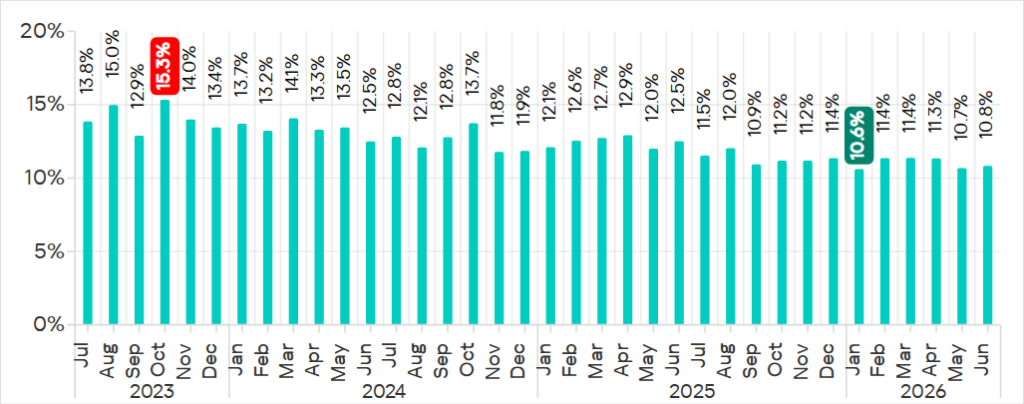
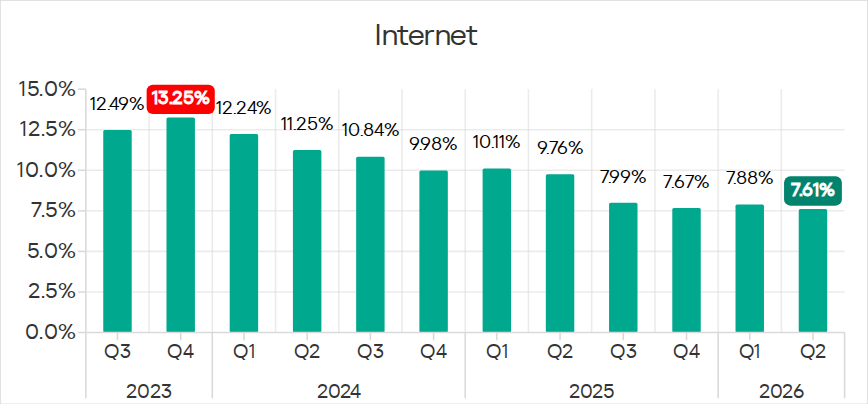
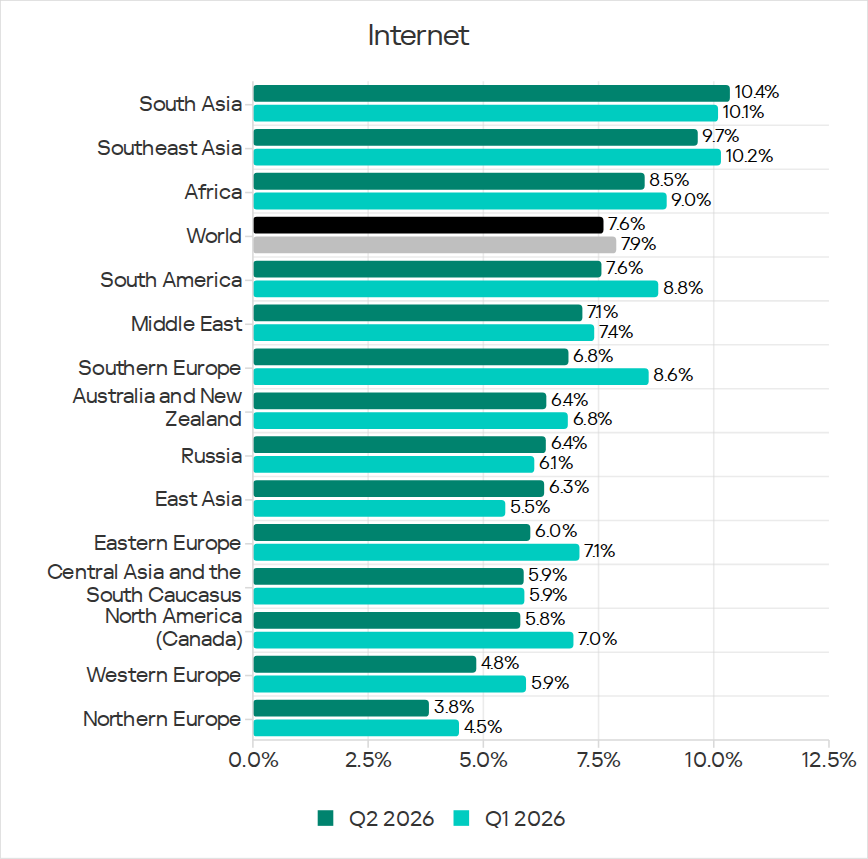
The percentage of ICS computers on which threats from the internet were blocked decreased to 7.61%, reaching its lowest level since 2021.
Regionally, the percentage of ICS computers on which threats from the internet were blocked ranged from 3.82% in Northern Europe to 10.35% in South Asia, which rose from second place to top the corresponding ranking. Second place was occupied by Southeast Asia (9.65%).
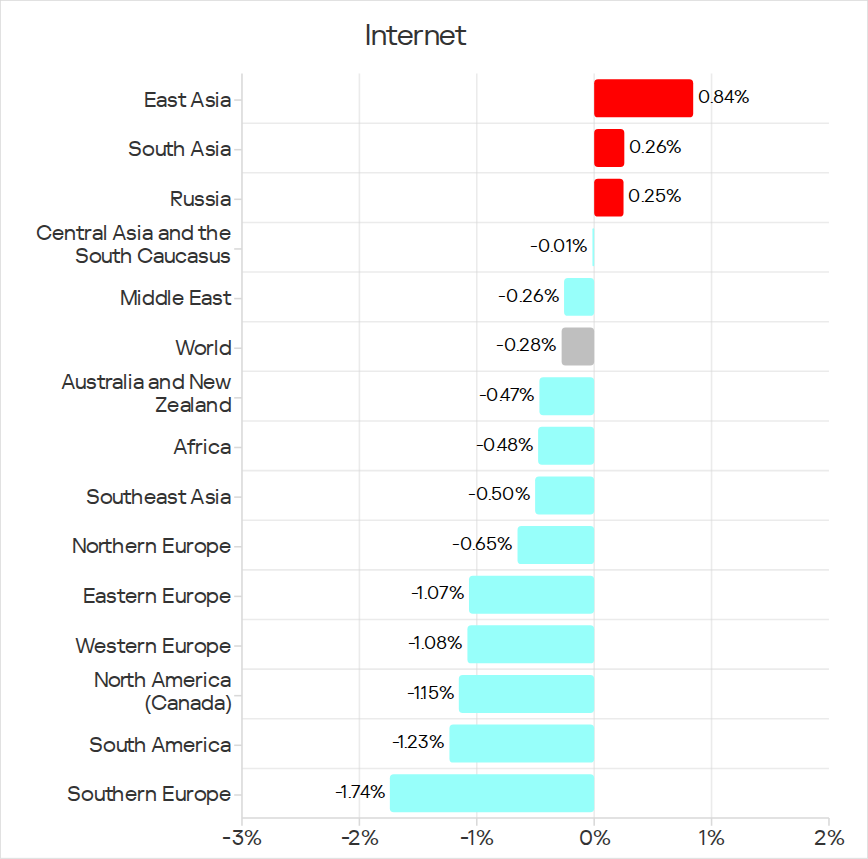
Over the quarter, the percentage increased in three regions: East Asia, South Asia, and Russia.
Note that in South Asia, the corresponding percentage in Bangladesh increased sharply (from 10.52% to 17.76%).
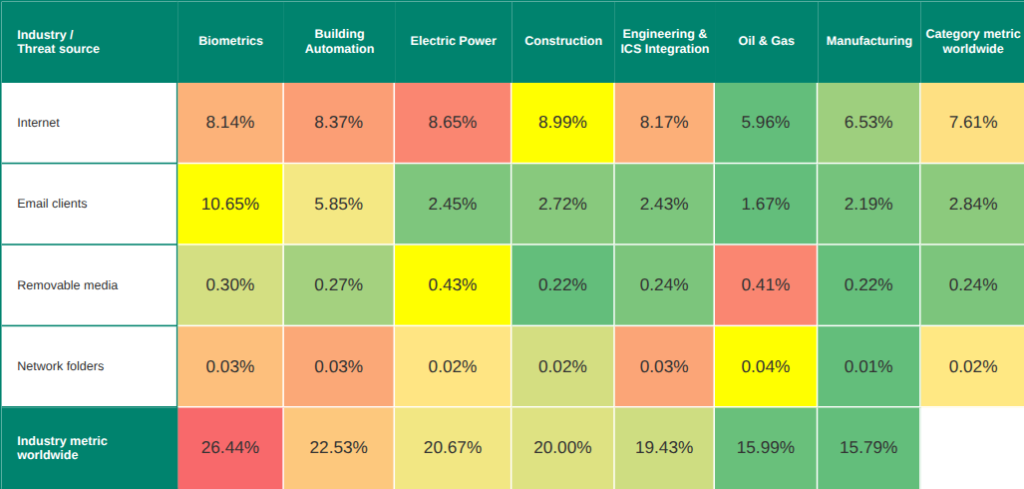
On average, the construction industry led the ranking among the selected industries in terms of the percentage of ICS computers on which threats from the internet were blocked (8.99%).
Among the selected industries across all regions, the top five for this parameter consists of industries in South and Southeast Asia.
- Biometrics in South Asia – 13.03%;
- Engineering and ICS integration in South Asia – 12.16%;
- Construction in Southeast Asia – 11.69%;
- Electric power in Southeast Asia – 11.24%;
- Production in South Asia – 10.94%.
Email clients
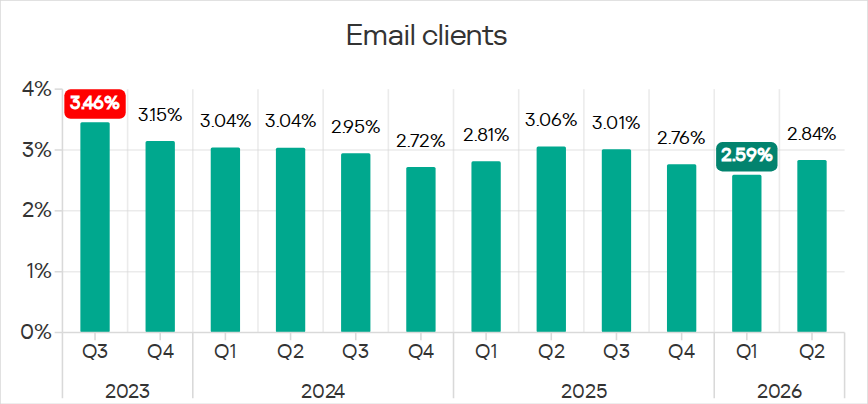
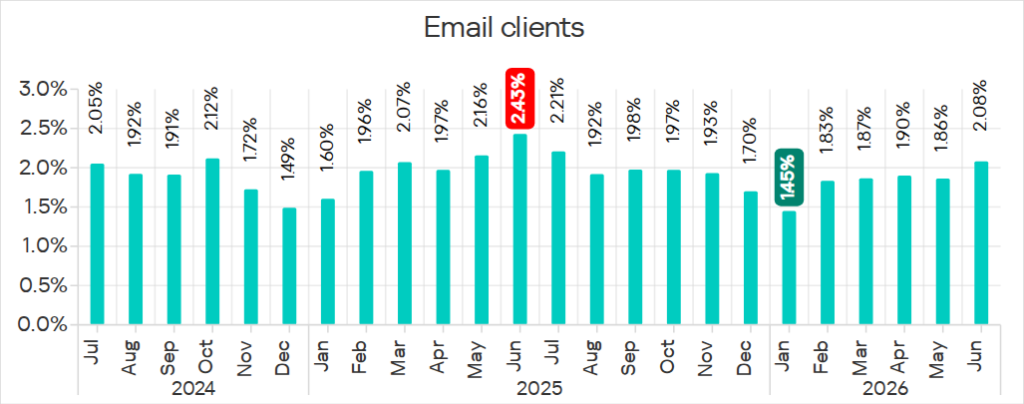
The percentage of ICS computers on which threats from email clients were blocked increased to 2.84%.
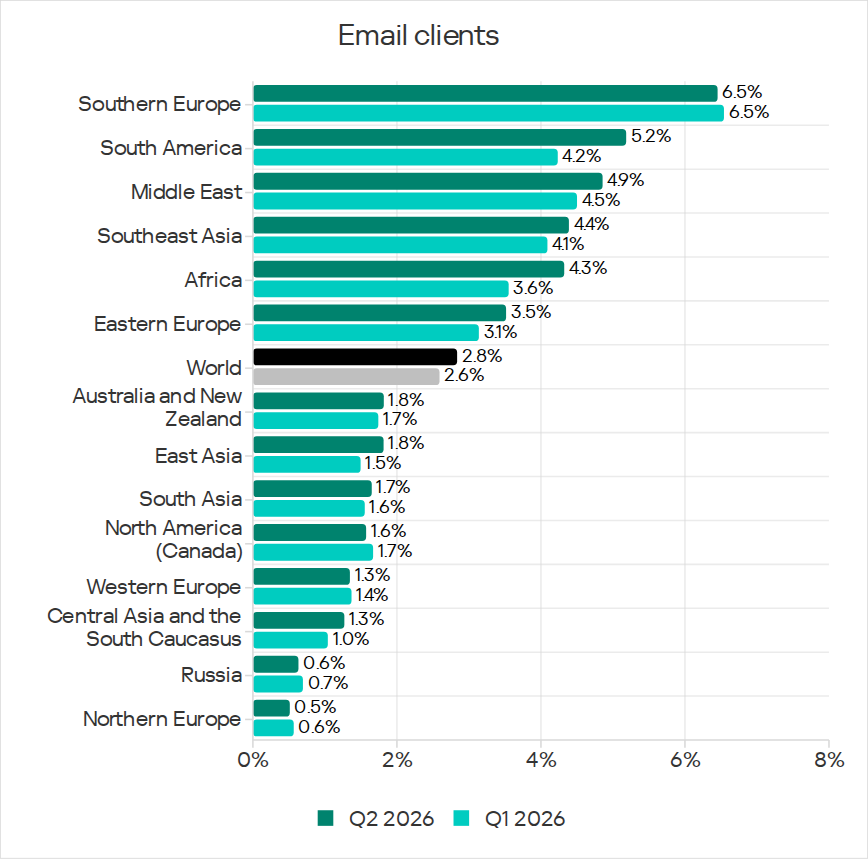
Regionally, the percentage ranged from 0.52% in Northern Europe to 6.45% in Southern Europe.
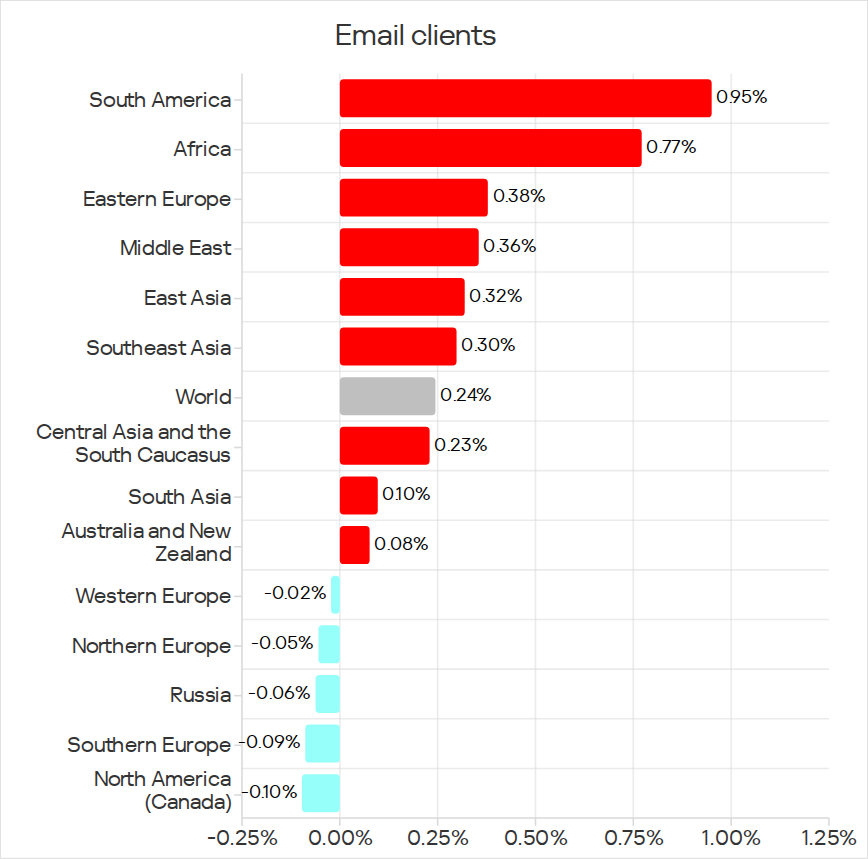
In Q2 2026, the percentage of ICS computers on which threats from email clients were blocked increased in South America (by 0.95 pp) and Africa (by 0.77 pp).
South America ranked second among the regions in terms of the percentage of ICS computers on which threats from email clients were blocked (5.2%).
Among the countries in the region, the highest values were in Mexico (8.35%) and Uruguay (7.41%). Among the industries surveyed in the region, biometrics had the highest rate (11.52%) and experienced the largest growth.
Africa ranked fifth among the regions in terms of the percentage of ICS computers on which threats from email clients were blocked (4.3%). Meanwhile, in Namibia, the figure was 12.35%. Among the selected industries in the region, building automation had the highest rate (8.06%), while biometrics saw the biggest increase.
On average, biometrics led the ranking among the selected industries in terms of the percentage of ICS computers on which threats from email clients were blocked (10.65%).
Among the selected industries across all regions, the top five for this parameter are:
- Biometrics in Southern Europe – 19,14%;
- Building automation in Southern Europe – 12.49%;
- Biometrics in South America – 11.52%;
- Building automation in Eastern Europe – 8.42%;
- Building automation in Africa – 8.06%.
Removable media
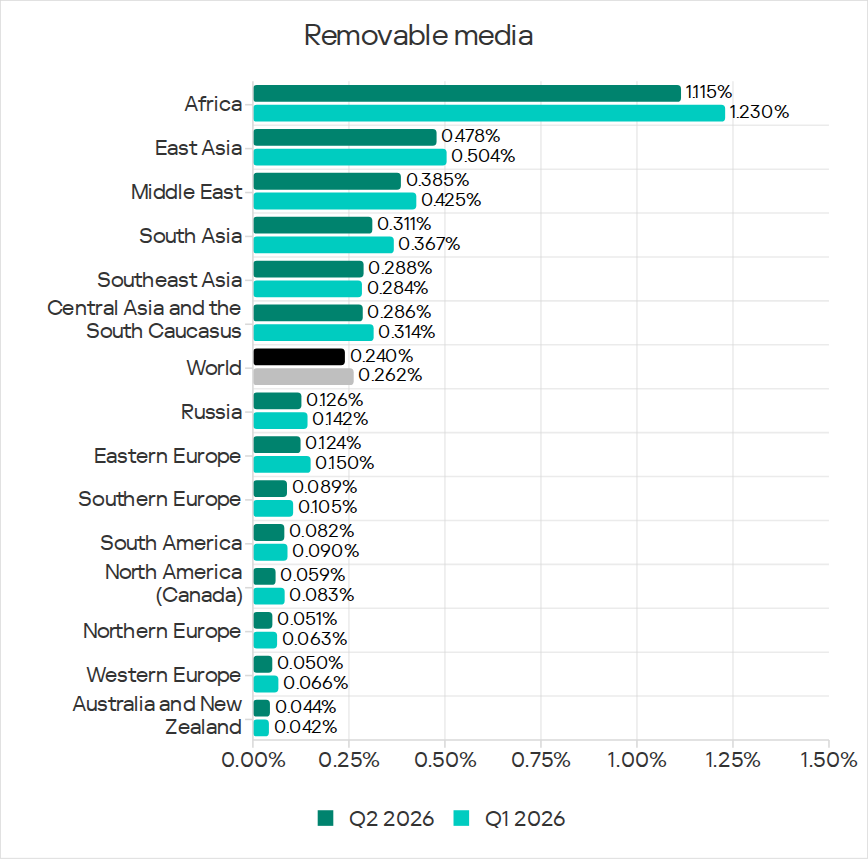
The percentage of ICS computers on which threats from removable media were blocked continued to decrease, reaching 0.24%, the lowest value for the period under review.
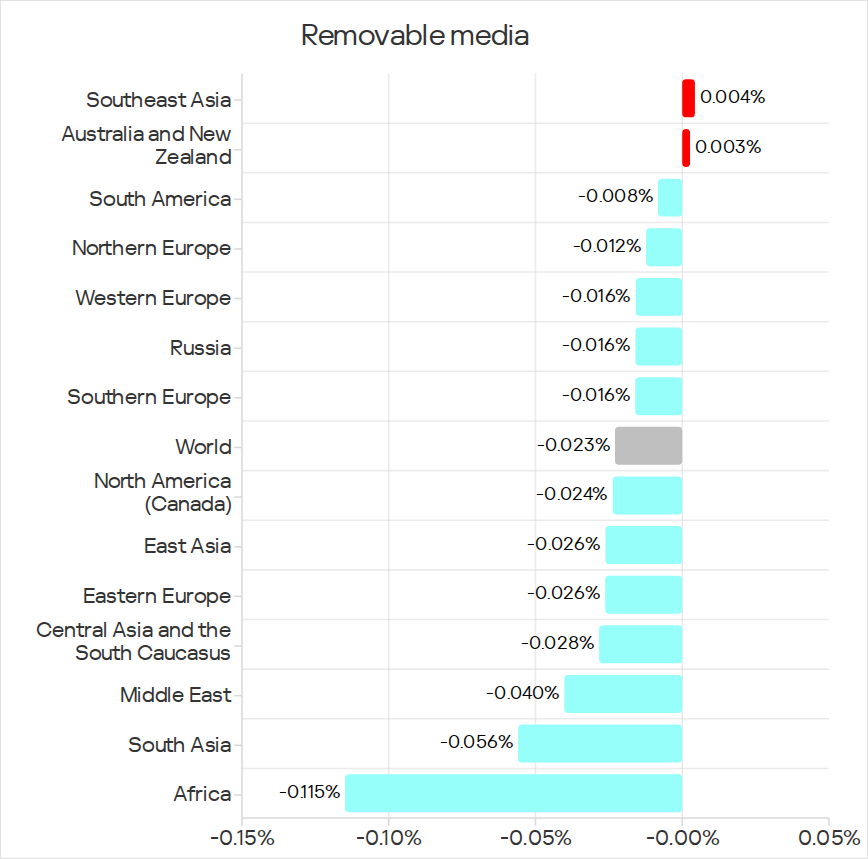
Regionally, the percentage ranged from 0.04% in Australia and New Zealand to 1.11% in Africa. Over the quarter, it decreased in all regions except Southeast Asia, and Australia and New Zealand, where the percentage figures remained virtually unchanged.
Africa is the long-term leader of this rating. Although the percentage of ICS computers on which threats from removable media were blocked is steadily decreasing in the region, the gap with other regions is still significant.
Among the selected industries in Africa, the highest percentage figures for threats from removable media were in the electric power industry (1.2%) and biometrics (1.29%).
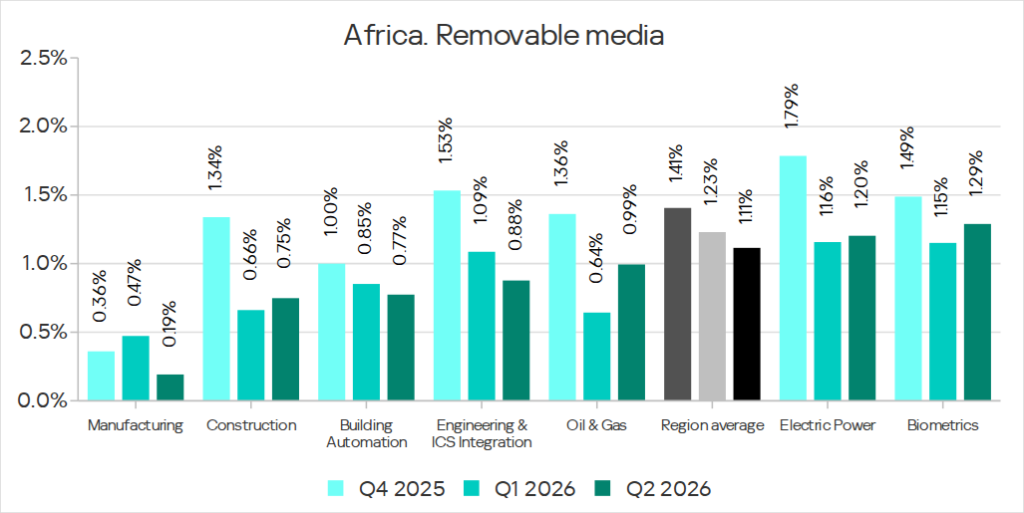
On average, the electric power industry led the ranking among the selected industries in terms of the percentage of ICS computers on which threats from removable media were blocked (0.43%).
Among the selected industries across all regions, the top five for this parameter are:
- Electric power industry in East Asia – 1.34%;
- Biometrics in Africa – 1.29%;
- Electric power industry in Africa – 1.20%;
- Biometric systems in South Asia – 1.06%;
- Oil and gas industry in Africa – 0.99%.
Network folders
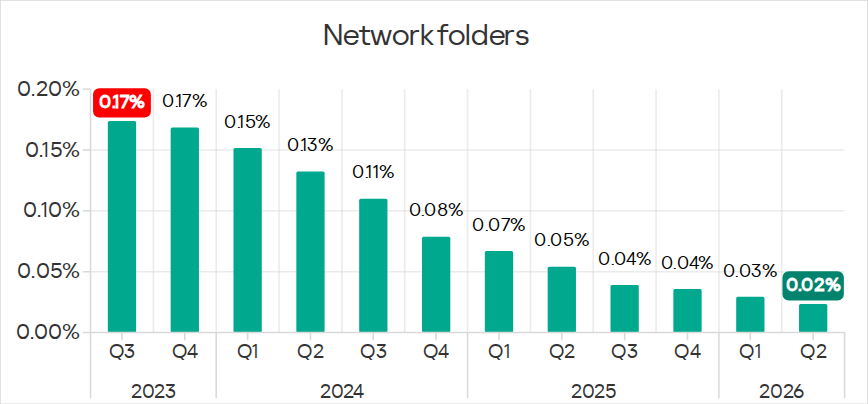
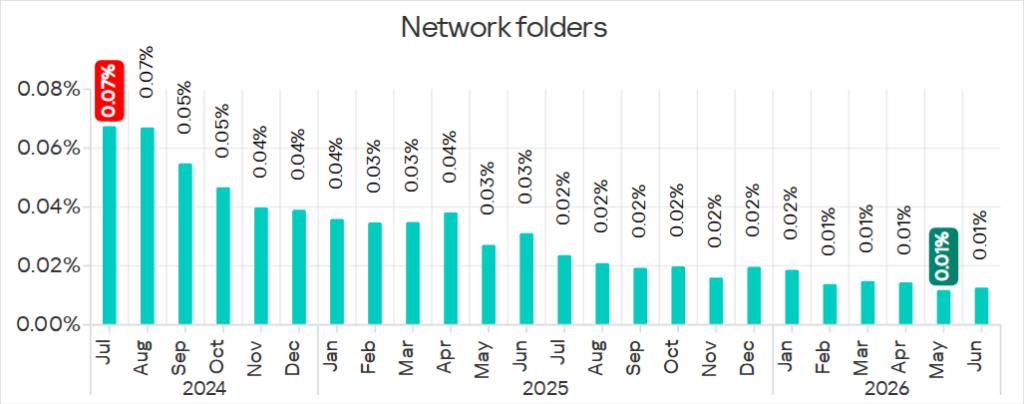
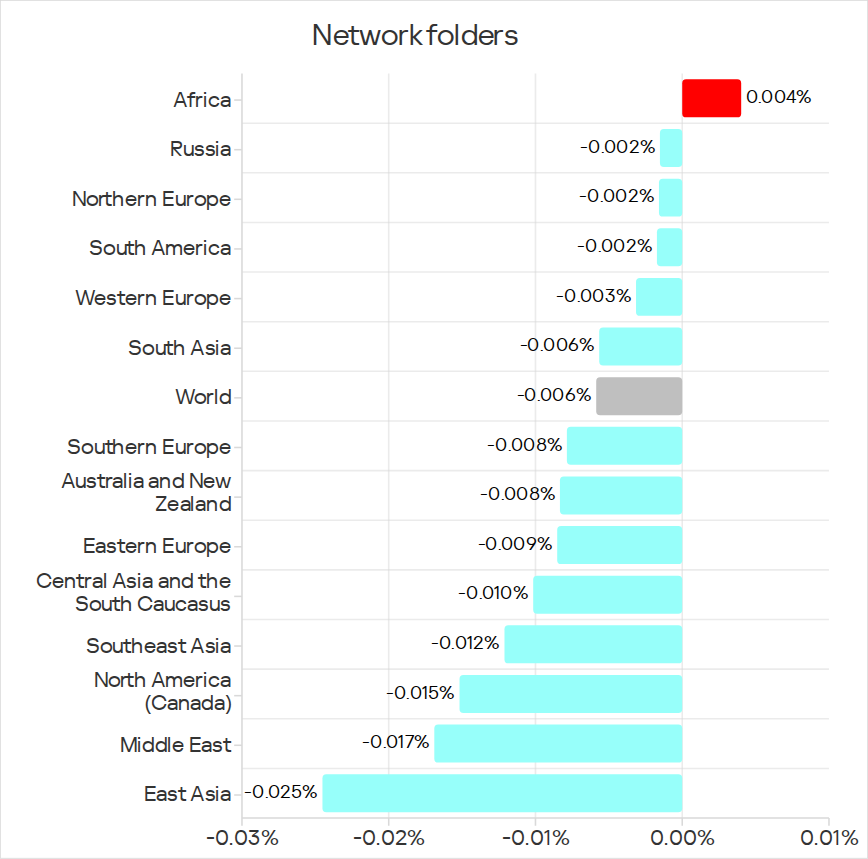
The percentage of ICS computers on which threats from network folders were blocked continued to decrease. In Q2 2026, it was the lowest for the period under review, at 0.023%.
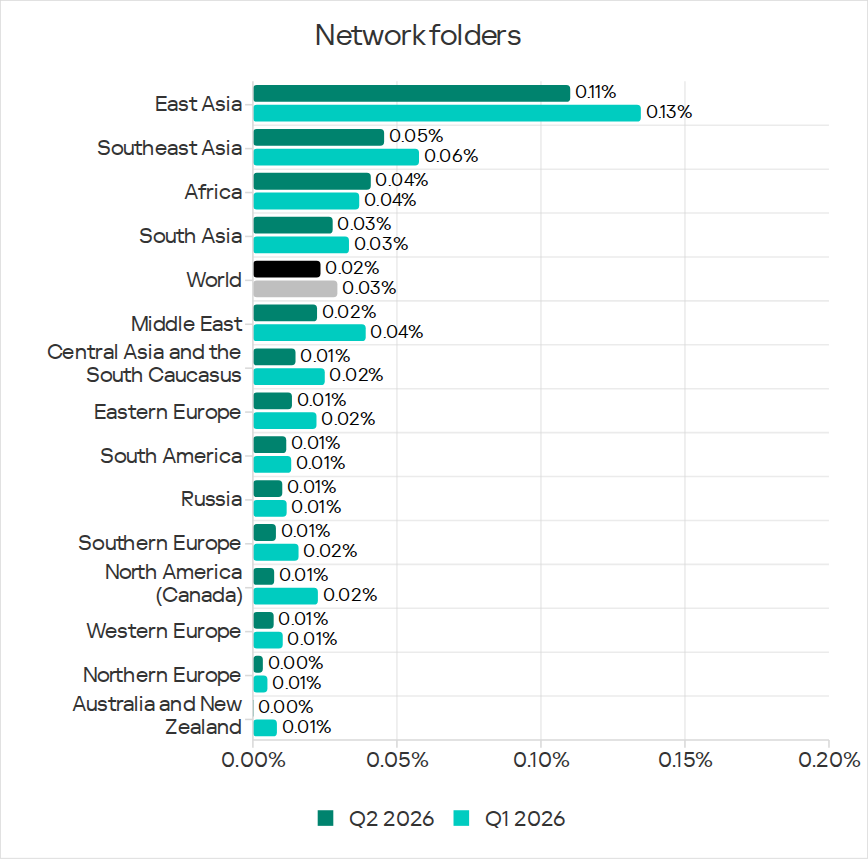
Regionally, the percentage ranged from 0.00% in Australia and New Zealand to 0.11% in East Asia.
East Asia has traditionally led this parameter by a wide margin over other regions. As with viruses and malware for AutoCAD, mainland China was the region’s undisputed leader in terms of threats from network folders (0.11%).
The only region to see an increase in the percentage of ICS computers on which threats from network folders were blocked during the quarter was Africa. This was mainly due to an increase in the building automation figure to 0.05%.
On average, the oil and gas industry led the ranking among the selected industries in terms of the percentage of ICS computers on which threats from network folders were blocked (0.04%).
Among the selected industries across all regions, the top five for this parameter include four industries in East Asia:
- Biometrics in East Asia – 0.23%;
- Building automation in East Asia – 0.17%;
- Engineering and ICS integration in East Asia – 0.13%;
- Biometrics in Southeast Asia – 0.11%;
- Construction in East Asia – 0.11%.
Statistics across all threats
All threats
Selected industries
Threat sources and malware categories in selected industries
We use heat maps when assessing the challenges across industries. Colors on the heat map indicate an indicator’s position in the global industry ranking by threat category or threat source. Yellow highlights the highest values across industries for a specific threat category or threat source. Red indicates that the value is close to the maximum.
Threat source indicators by industry (global), Q2 2026
Threat category indicators by industry (global), Q2 2026
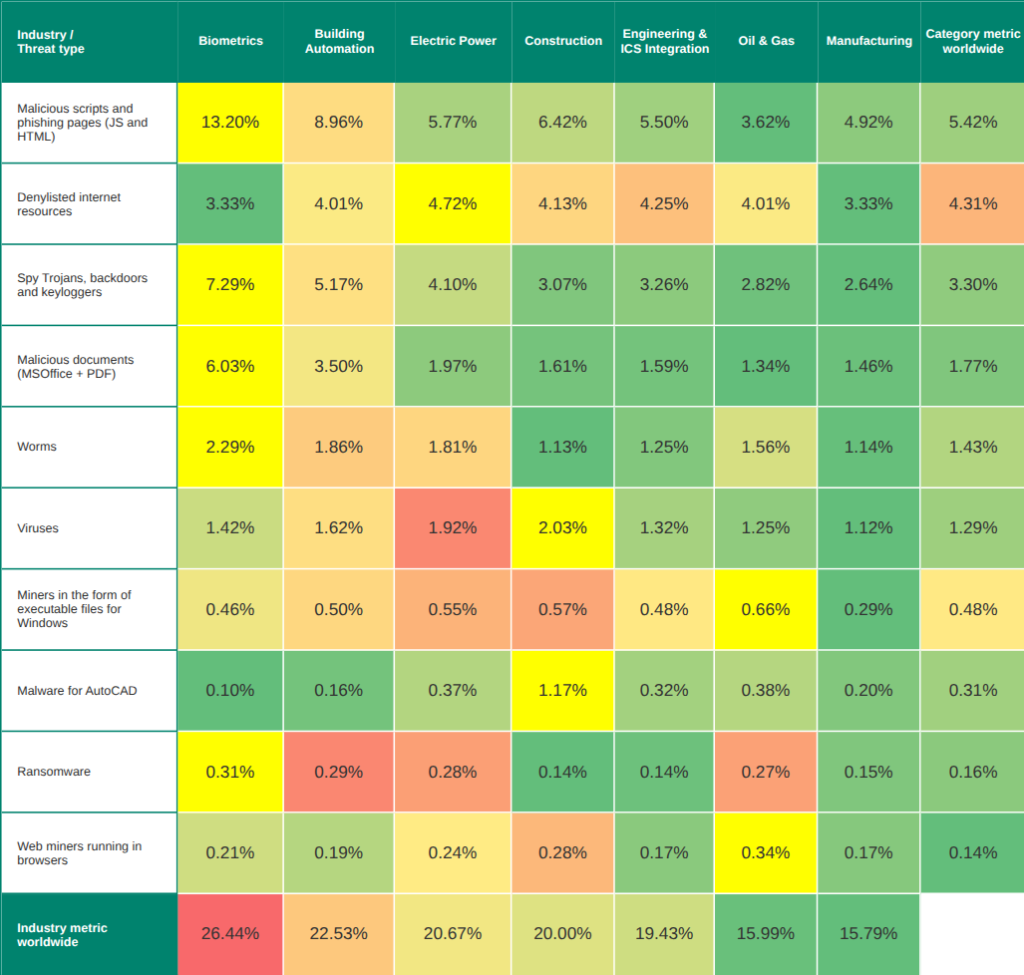
Biometrics ranks highest across industries in terms of percentage figures for email threats. It is worth noting that, unlike in other industries, the percentage figure for threats from email clients in biometrics exceeds that for threats from the internet.
Email is a source of malicious scripts and malicious documents. Following a malicious link in an email or opening an attachment from a phishing email can cause the computer to become infected with spyware. Spyware, in turn, can be used (among other things) to steal information needed to deliver other types of malware, such as ransomware.
Biometrics lead in all of the following malware categories: malicious scripts and phishing pages, malicious documents, spyware, and ransomware.
The electric power industry ranks first in terms of the percentage of ICS computers on which threats from removable media were blocked, and third for worms (which are distributed primarily via removable media). Threats from the internet are also relevant to this industry, and the percentage figure for the electric power industry for this threat source is the second highest among all industries. At the same time, the electric power industry ranks first in terms of denylisted internet resources.
Building automation ranks second for the same set of threats as biometrics above (malicious scripts and phishing pages, malicious documents, spyware, and ransomware), as well as for threats from email clients.
The construction industry ranks first in terms of threats from the internet and third for the percentage of ICS computers on which denylisted internet resources were blocked. This industry also leads in terms of viruses and malware for AutoCAD.
The oil and gas industry ranks first in terms of threats from network folders and miners that were blocked on its ICS computers.
Threat categories
Attacks blocked within an ICS network are typically multi-step sequences of malicious operations, in which each subsequent step by the attackers is designed to gather additional information, elevate privileges, and/or gain access to other systems by exploiting security issues existing in industrial enterprises, including their OT infrastructures.
Malicious objects blocked by Kaspersky products on ICS computers can be divided into three groups based on their distribution methods and purposes.
- Malicious objects used for initial infection.
This category includes predominantly denylisted internet resources, malicious scripts and phishing pages, and malicious documents. - Next-stage malware.
This typically includes spyware, ransomware, miners in the form of executable files for Windows, and web miners. - Self-propagating malware.
This category includes worms and viruses.
Malware for AutoCAD is not grouped by distribution method, as it can spread in various ways.
Malicious objects designed for the initial infection of ICS computers are used extensively by attackers, so security solutions block these objects more often than other groups. Our statistics reflect this: globally and in almost all regions, malicious scripts and phishing pages, as well as denylisted internet resources, appear at the top of threat category rankings by the percentage of ICS computers on which they were blocked.
It should be noted that, in a small percentage of cases, the threat categories that we classify as malicious objects used for initial infection, such as malicious links, can also be used in subsequent stages of an attack. For example, a link to a malicious resource may sometimes be detected while scanning the system registry on a computer, where it evidently appeared as a result of activity by another malicious program before that malware was identified and blocked. A stricter classification of attacked ICS computers, based on the categories of blocked malware and sources of infection, is described in our article, “Dynamics of external and internal threats to industrial control systems”, which opens a new series of publications presenting the results of in-depth research into the ICS threat landscape based on statistics showing when different components of our security products were triggered.
It is worth noting that the techniques used to deploy malware online are diverse, extensive, and accessible to any attacker. Any web service (even the most secure) can be used as a web storage if it allows data to be stored and retrieved. In practice, this means that protection of an ICS network (like any other) should rely on the entire stack of protection technologies, not just protection of the network perimeter.
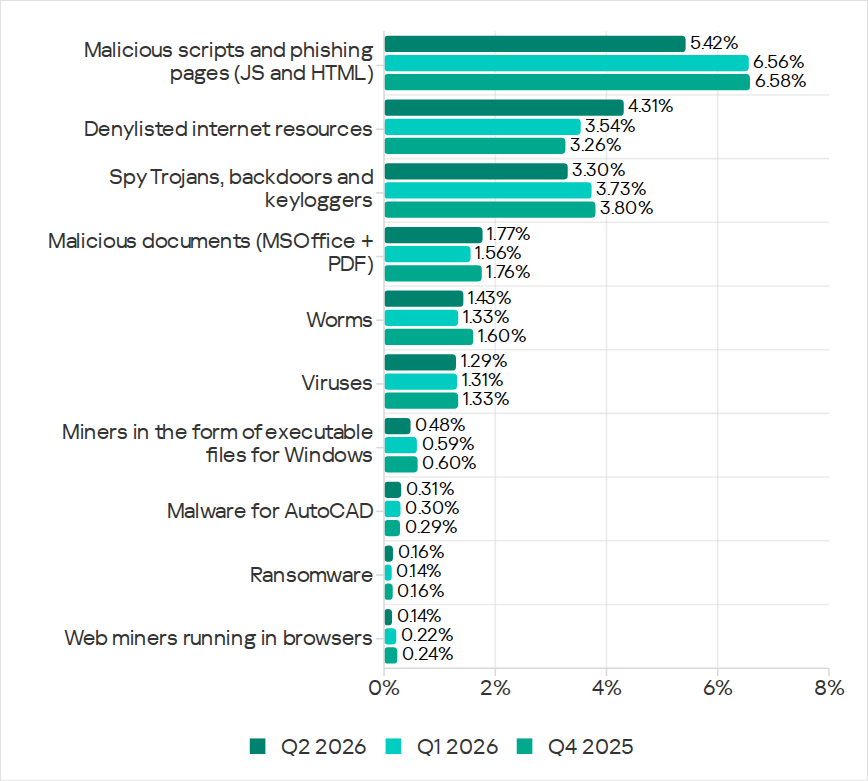
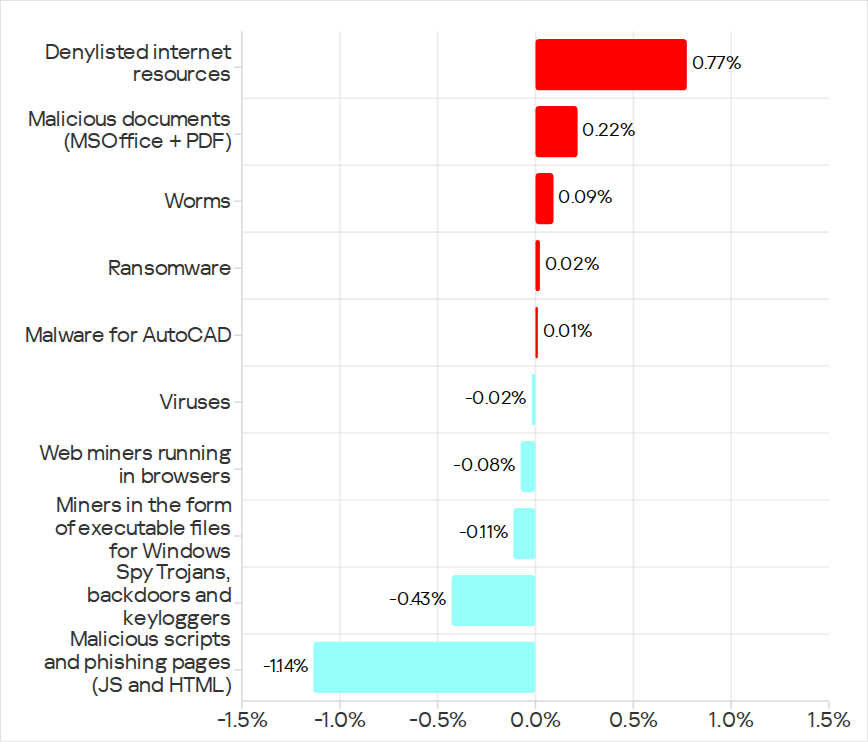
Malicious objects used for initial infection
Denylisted internet resources
The denylist of internet resources is used to prevent initial infection attempts. It mainly helps to block the following objects on ICS computers:
- Known malicious URLs and IP addresses used by threat actors to host payloads and configurations.
- Suspicious (insecure) web resources with entertainment and gaming content, often used to deliver unwanted software, cryptocurrency miners, and malicious scripts.
- CDN nodes used by attackers to distribute malicious scripts on popular websites.
- File and data exchange services, including repositories, often used by attackers to host configurations and next-stage payloads.
A significant part of these resources is used to distribute malicious scripts and phishing pages (HTML).
A detected malicious web resource may not always be easily added to a denylist because attackers are increasingly using legitimate internet resources and services, such as content delivery network (CDN) platforms, messengers, repositories, and cloud storage. These services allow malicious code to be distributed via unique links to unique content, making it difficult to use reputation-blocking tactics. We strongly recommend that industrial organizations implement policy-based blocking of such services, at least for OT networks where they are needed extremely rarely for objective reasons.
High parameter values usually indicate weak control over the implementation of information security policies (ICS computers have access to the internet in one way or another, and this access is frequently used), phishing protection weaknesses (many malicious links are delivered via phishing messages), and deficiencies in information security culture (employees visit insecure internet resources and follow malicious links from suspicious emails and social media messages).
In the Q2 2026 ranking of malicious object categories by the percentage of attacked ICS computers, denylisted internet resources returned to second place.
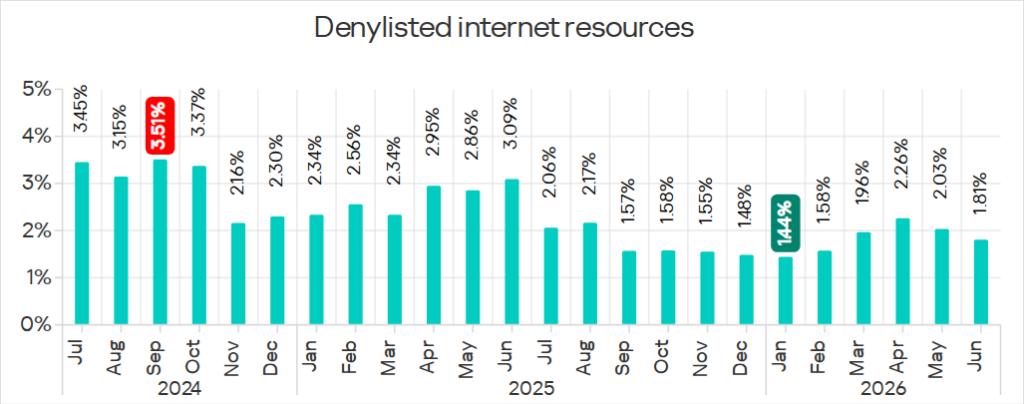
In April 2026, the percentage of ICS computers on which denylisted internet resources were blocked was the highest it had been in the last year.
In Q2 2026, Russia ranked first among the regions in terms of the percentage of ICS computers on which denylisted internet resources were blocked for the first time in two years.
Malicious scripts and phishing pages (JS and HTML)
Malicious actors use scripts for a wide range of objectives: from collecting information, tracking, and redirecting the user’s browser to a malicious web resource to uploading various types of malware (e.g., spyware, silent crypto mining tools, and ransomware) to the user’s system or browser. They spread via the internet and email.
Malicious documents (MSOffice + PDF)
Attackers mainly send malicious documents attached to phishing messages and use them in attacks aimed at the initial infection of computers. Malicious documents typically contain exploits, malicious macros, and links to malware.
Malicious documents, especially those using zero-day exploits, remain a popular vector for targeted attacks. In 2025, CISA released more than 450 security advisories, many of which concerned file handling, including popular document formats.
Next-stage malware
Malicious objects used to initially infect computers deliver next-stage malware to victims’ machines. As a rule, this is spyware, ransomware, and miners. Typically, the higher the percentage of ICS computers on which the initial infection malware is blocked, the higher the percentage for next-stage malware.
Spyware
Spyware (Trojans, backdoors, and keyloggers) can be found in lots of phishing emails sent to industrial organizations. Spyware is the most frequently detected next-stage malware. It is used as a tool for the intermediate stages of a cyberattack (for example, reconnaissance and lateral movement) or in the final stage of the attack to steal and exfiltrate confidential data. The ultimate goal of most spyware attacks is to steal money, but spyware is also used in targeted attacks for cyberespionage.
Spyware is also used to steal information needed to deliver other types of malware, such as ransomware and silent cryptocurrency mining tools, and to prepare for targeted attacks.
Detection of spyware on an ICS computer usually indicates that the initial infection vector succeeded, whether it was clicking on a malicious link, opening an attachment from a phishing email, or connecting an infected USB drive. This points to the absence or ineffectiveness of measures to protect the OT network perimeter (such as monitoring the security of network communications and implementing policies on the use of removable media).
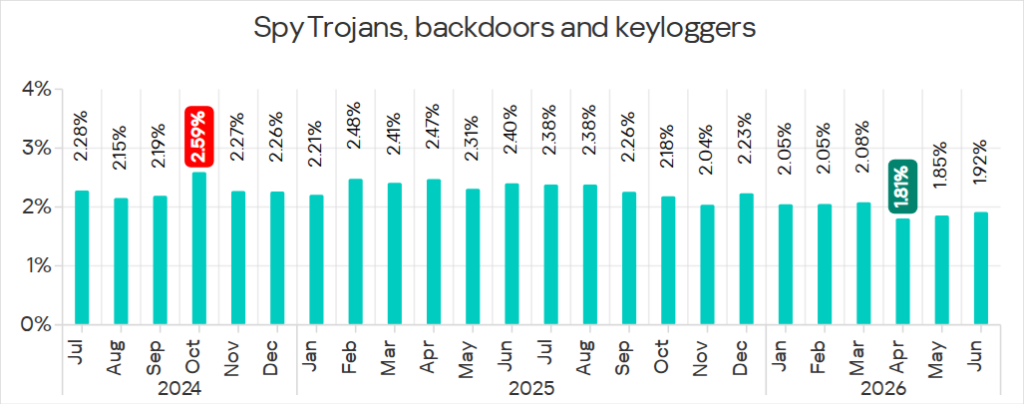
In Q2 2026, the percentage of ICS computers on which spyware was blocked was the lowest since 2022.
Ransomware
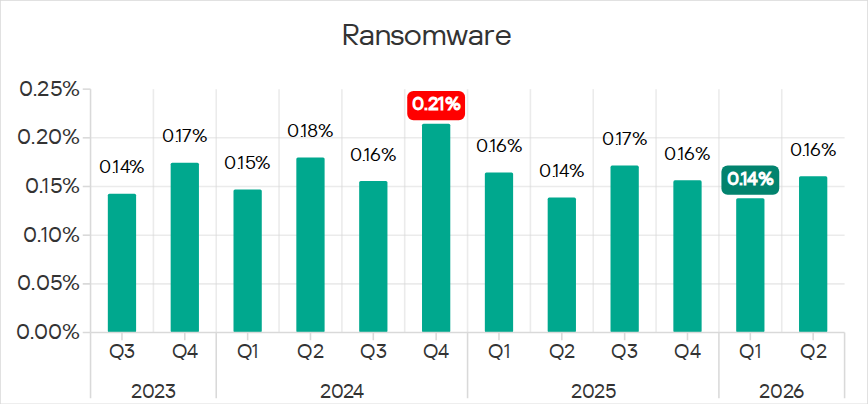
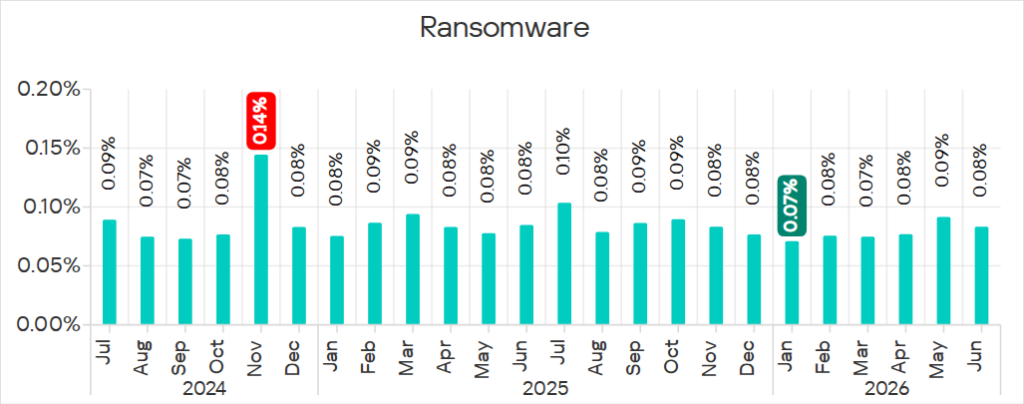
Miners in the form of executable files for Windows
In addition to “classic” miners — applications written in .NET, C++, or Python and designed for surreptitious crypto mining — new forms are emerging. Popular “fileless” execution techniques continue to be adopted by threat actors, including those who implant crypto miners on OT machines.
A significant portion of Windows miners found on ICS computers consists of archives with names that mimic legitimate software. These archives contain no actual software but include a Windows LNK file, commonly known as a shortcut. However, the target (or path) that the LNK file points to is not a legitimate application but rather a command that can execute malicious code, such as a PowerShell script. Attackers are increasingly using PowerShell with malware code (including miners) embedded in the command line arguments and executed entirely in memory, i.e., via fileless execution. The fileless execution of a miner makes it difficult for security tools to detect.
Another common method for deploying miners in the OT infrastructure involves using legitimate cryptocurrency mining software such as XMRig, NBMiner, OneZeroMiner, etc. While these miners are not inherently malicious, security systems classify them as RiskTools. Attackers exploit these miners by combining them with customized configuration files that enable the miner’s activity to be concealed from the user.
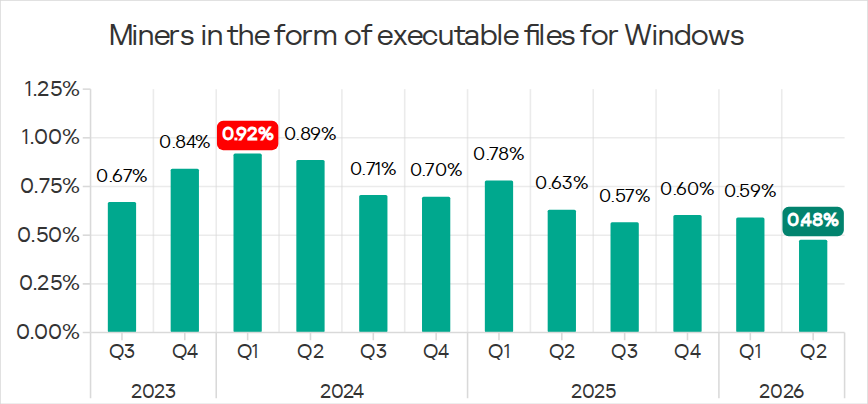
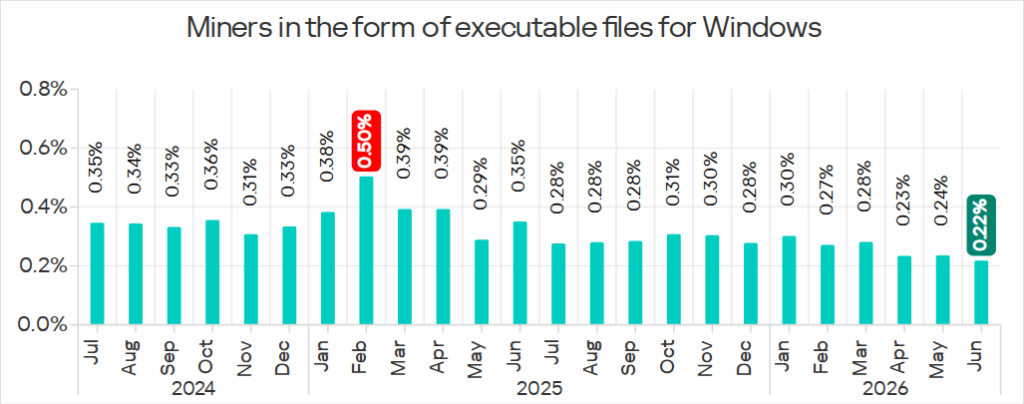
June 2026 saw the lowest monthly percentage figure in three years.
Web miners
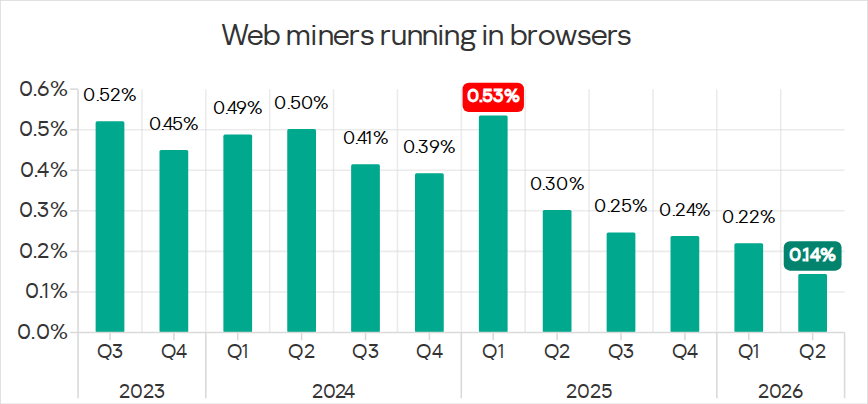
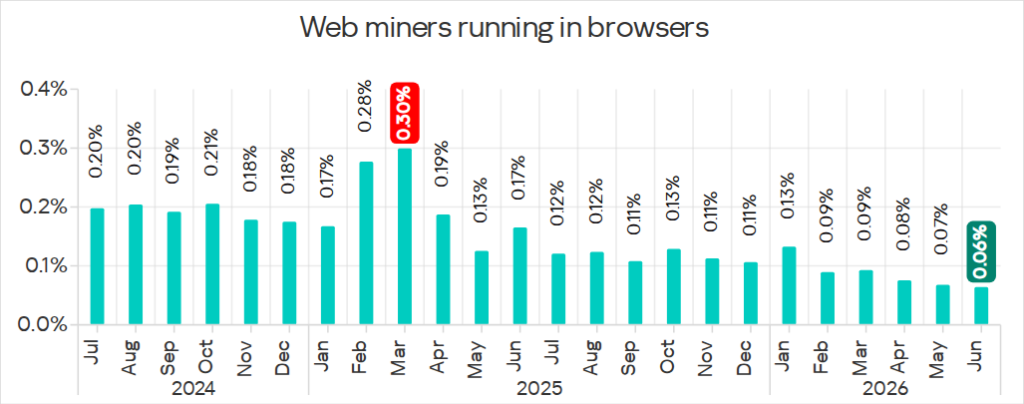
In June 2026, the monthly percentage figure of web miners, as well as miners in the form of executable files for Windows, was the lowest in three years.
Self-propagating malware
Self-propagating malware (worms and viruses) is a category unto itself. Worms and virus-infected files were originally used for initial infection, but as botnet functionality evolved, they took on next-stage characteristics.
To spread across ICS networks, viruses and worms rely on removable media and network folders, propagating as infected files, such as archives containing backups, office documents, pirated games, and hacked applications. In rarer and more dangerous cases, infected objects include web pages with network equipment settings or files stored in internal document management systems, product lifecycle management (PLM) systems, resource management (ERP) systems, and other intranet services.
Most worms and viruses detected on removable media are either variants of outdated polymorphic threats (which appeared around 2010) or modern modular cryptocurrency miners.
It should be kept in mind that some worms and viruses spread through active techniques, such as password brute-force attacks, theft and use of user authentication data (including access tokens), and network attacks on vulnerable software, all of which have long been part of the modular toolkit of any modern worm-miner.
Modern versions of worms are not often found in ICS networks, but the damage caused by an infection is always significant: even basic maintenance of a network infected with worm-miners becomes several times more expensive due to longer downtime and the additional man-hours required to restore performance. And if a worm is used to download ransomware to a computer in an OT network after preliminary profiling, the cost is exponentially higher.
At the same time, a significant part of the viruses and worms that spread today are legacy modifications whose command-and-control servers have been shut down. However, these types of malware can not only compromise infected systems, for example, by opening network ports and changing configurations, but also cause software failures, denial of service, etc.
High percentage figures for self-propagating malware and malware spreading via network folders at the industry, country, or regional level likely indicate the presence of unprotected OT infrastructure that lacks even basic endpoint protection. These unprotected computers become sources of malware propagation. The situation may be exacerbated by weak segmentation of the enterprise network and a lack of control over the use of removable media.
Worms
Viruses
Malware for AutoCAD
This category of malware can spread in various ways, so it does not belong to a specific group.
Malware for AutoCAD is typically a low-level threat, which ranks last in the malware category rankings by the percentage of ICS computers on which it is blocked.
Main threat sources
Depending on the threat detection and blocking scenario, it is not always possible to reliably identify a threat’s source. The type (category) of a blocked threat can be used as circumstantial evidence.
The internet (visiting malicious or compromised internet resources; malicious content distributed via messengers; cloud data storage and processing services and CDNs), email clients (phishing emails), and removable media remain the primary sources of threats to computers in organizations’ OT infrastructure.
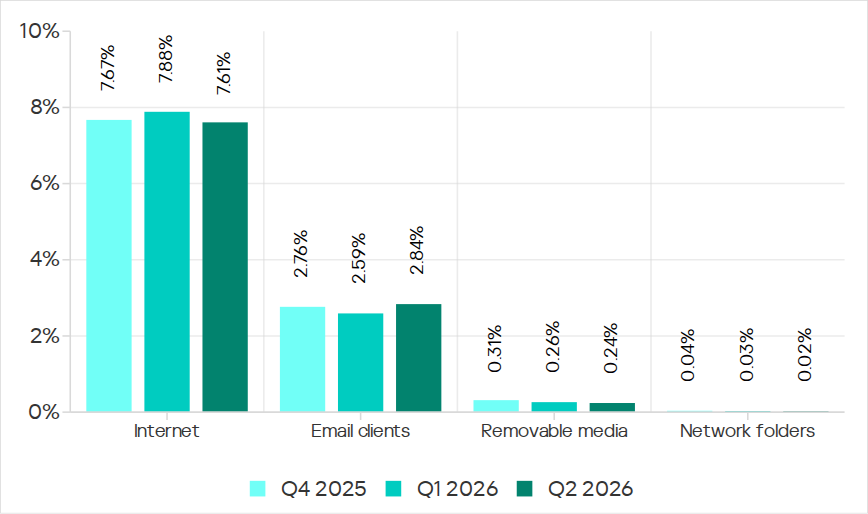
In Q2 2026, the percentage of ICS computers on which threats from various sources were blocked increased only for email clients.
Internet
Detection and blocking of internet threats on ICS computers protected by Kaspersky products means that access to external services was allowed from these computers at the time of detection.
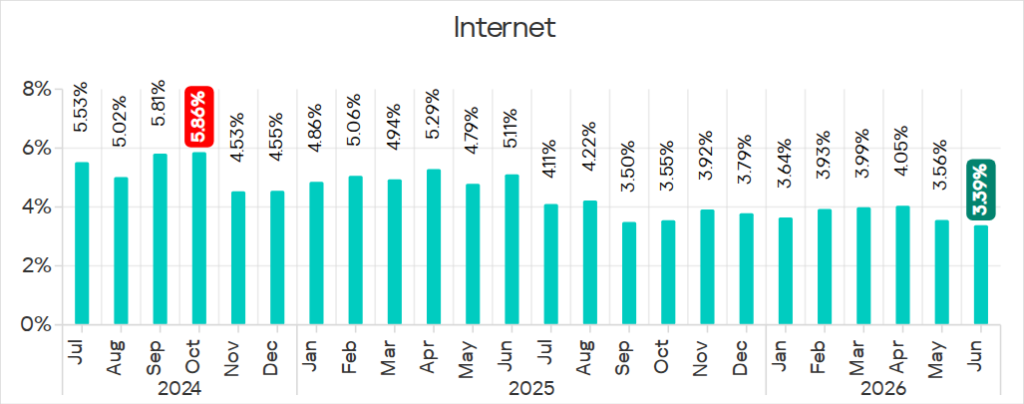
In June 2026, the monthly percentage figure was the lowest in three years.
The main categories of threats from the internet* blocked on ICS computers in Q2 2026 were malicious scripts and phishing pages, and denylisted internet resources.
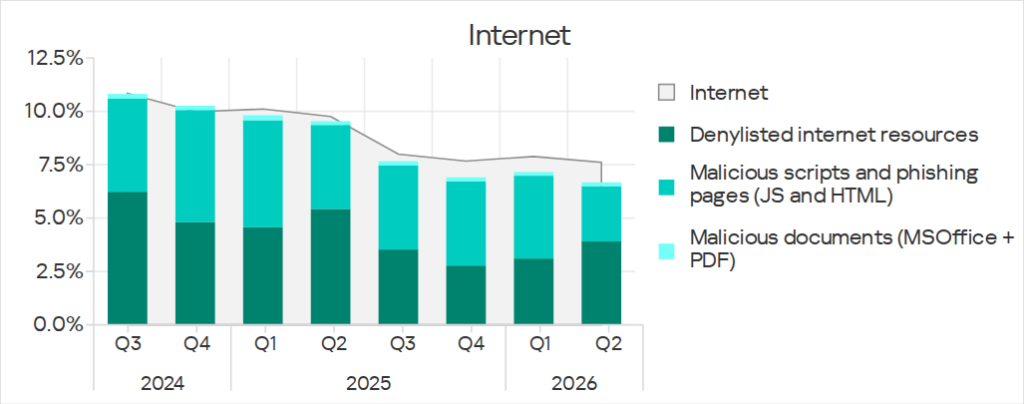
*It should be kept in mind that the same computer can be attacked by several categories of malware from the same source during a quarter. That computer is counted when calculating the percentage of attacked computers for each threat category, but is only counted once for the threat source (we count unique attacked computers). In addition, it is not always possible to accurately determine the source of the initial infection attempt. Therefore, the total percentage of ICS computers on which various categories of threats from a certain source were blocked can exceed the percentage of threats from that source.
Email clients
Some detected and blocked threats are delivered to protected computers via the email delivery system and/or attempt to gain access through the email client application.
The main categories of email threats blocked on ICS computers in Q2 2026 were malicious scripts and phishing pages, spyware, and malicious documents. The percentage of computers on which worms from email clients were blocked increased.
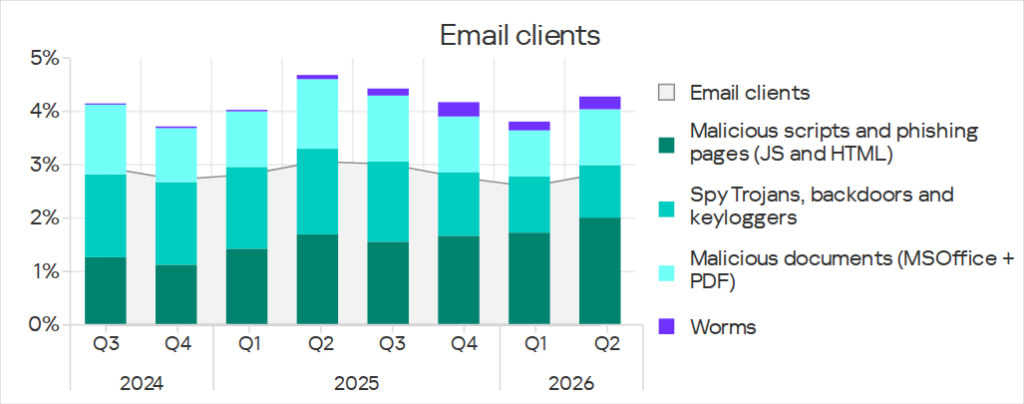
Most of the spyware detected in phishing emails was delivered as a password-protected archive or a multi-layered script embedded in office document files.
Removable media
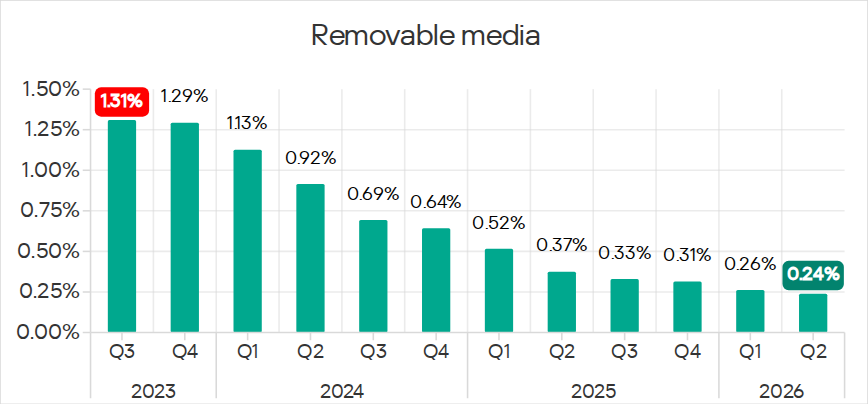
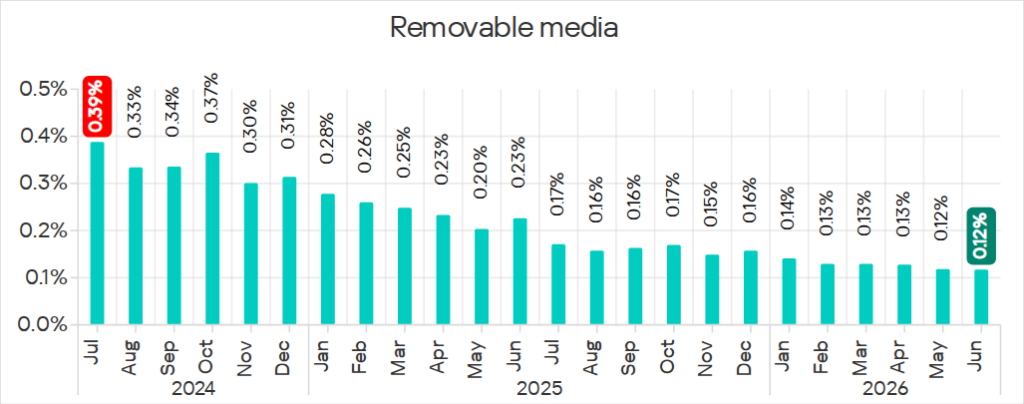
In June 2026, the monthly percentage figure was the lowest in three years.
The main categories of threats blocked in Q2 2026 when removable media were connected to ICS computers were worms, viruses, and spyware.
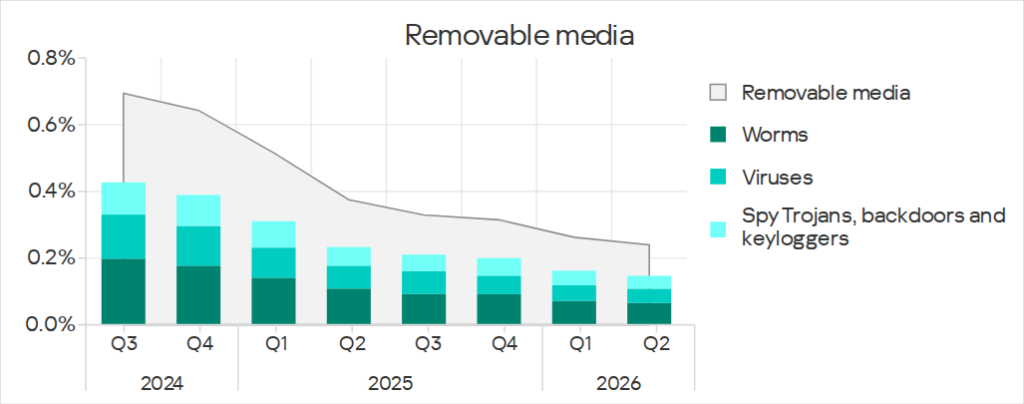
Most worms and viruses detected on removable media are either variants of outdated polymorphic threats (which appeared around 2010) or modern modular cryptocurrency miners. These modern cryptocurrency miners can spread across local networks by stealing credentials from infected hosts, exploiting known but unpatched vulnerabilities, and performing brute-force attacks on network services.
Most of the spyware detected on removable media consisted of universal components of both modern and outdated worms, such as stealers, loaders, and AV killers.
Network folders
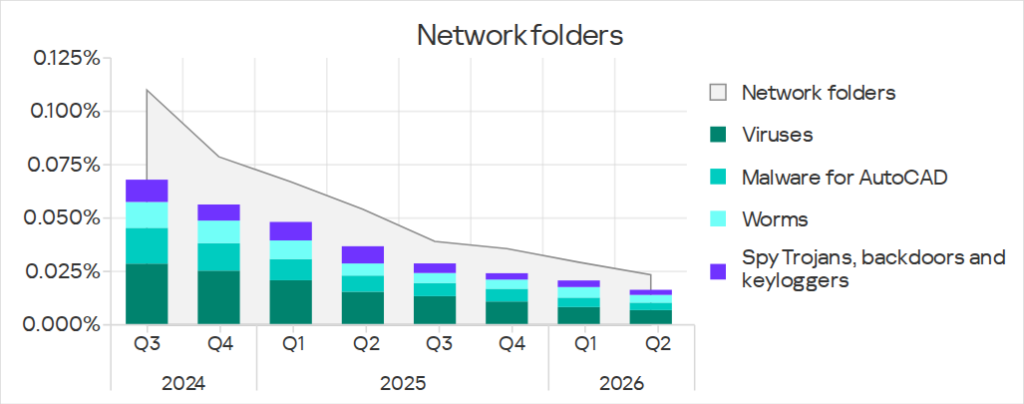
The main categories of threats distributed via network folders in Q2 2026 were viruses, malware for AutoCAD, worms, and spyware.
Methodology used to prepare statistics
This report presents the results of analyzing statistics obtained with the help of a distributed antivirus network called the Kaspersky Security Network (KSN). The data was received from KSN users who confirmed their voluntary consent to share data anonymously and to have it processed for the purposes described in the KSN Agreement for the Kaspersky product installed on their computer.
The benefits of joining KSN for our customers include faster response to previously unknown threats and a general improvement in the quality of detection by their Kaspersky installation, achieved by connecting to a cloud-based repository of malware data that is not transferable to the customer in its entirety by nature of its size and the amount of resources that it uses.
Data shared by the user contains only the data types and categories described in the appropriate KSN Agreement. This data helps to a significant extent in analyzing the threat landscape and serves as a prerequisite for detecting new threats, including targeted attacks and APTs1.
Statistical data presented in the report was obtained from ICS computers that were protected with Kaspersky products and categorized by Kaspersky ICS CERT as enterprise OT infrastructure. This group includes Windows computers that serve one or several of the following purposes:
- Supervisory control and data acquisition (SCADA) servers;
- Building automation servers;
- Data storage (Historian) servers;
- Data gateways (OPC);
- Stationary workstations of engineers and operators;
- Mobile workstations of engineers and operators;
- Human Machine Interface (HMI);
- Computers used to manage OT and building automation networks;
- Computers of ICS/PLC programmers.
Computers that share statistics with us belong to organizations from various industries. The most common are the chemical industry, metallurgy, ICS design and integration, oil and gas, energy, transport and logistics, the food industry, light industry, and pharmaceuticals. This also includes systems from engineering and integration firms that work with enterprises in a variety of industries, as well as building management systems, physical security, and biometric data processing.
We consider a computer as attacked if a Kaspersky security solution blocked one or more threats on that computer during the period under review: a month, six months, or a year, depending on the context, as can be seen in the charts above. To calculate the percentage of machines whose malware infection was prevented, we take the ratio of the number of computers attacked during the period under review to the total number of computers in the selection from which we received anonymized information during the same period.
- We recommend that organizations that have any restrictions in place with respect to transferring data outside the organization’s perimeter consider using the Kaspersky Private Security Network service. ↩︎