10 June 2025
Threat landscape for industrial automation systems. Regions, Q1 2025
Q1 overview
Percentage of ICS computers
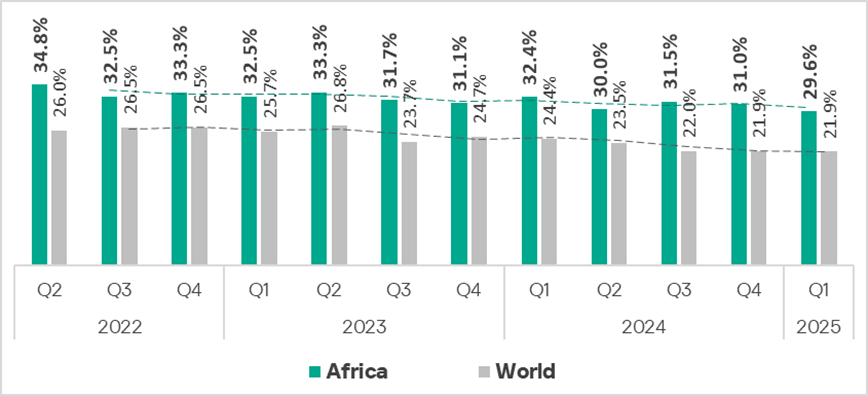
In the first quarter of 2025, the global percentage of ICS computers on which malicious objects were blocked remained unchanged at 21.9%.
Regionally, the percentage varied from 10.7% in Northern Europe to 29.6% in Africa.
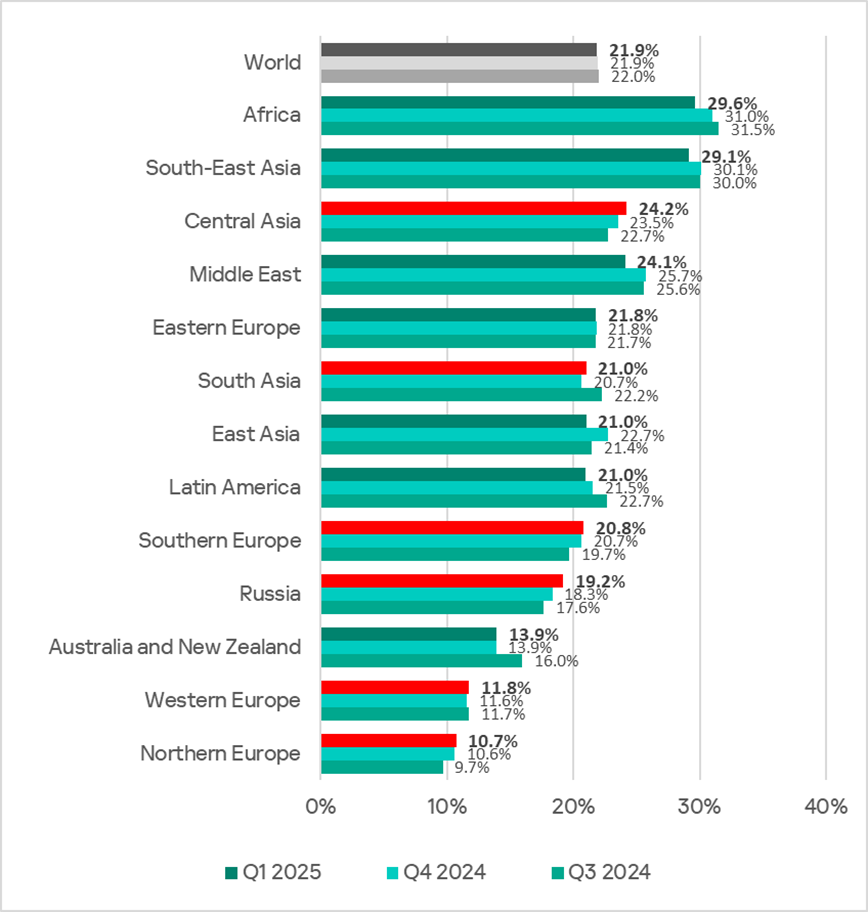
All regions ranked by percentage of ICS computers on which malicious objects were blocked in the first quarter can be divided into three groups:
|
Over 25%
|
In the regions within this group, OT computers are generally overexposed to cyberthreats. There is underinvestment in cybersecurity, both in terms of tools and measures, as well as in addressing the shortage of experts, fostering a strong cybersecurity culture, and raising awareness. |
|
20–25%
|
The regions within this group may face specific challenges in isolating their OT infrastructure from potential cyberthreats. |
|
Up to 20%
|
The third group consists of regions that are the safest in terms of keeping their OT infrastructure isolated from cyberthreats. |
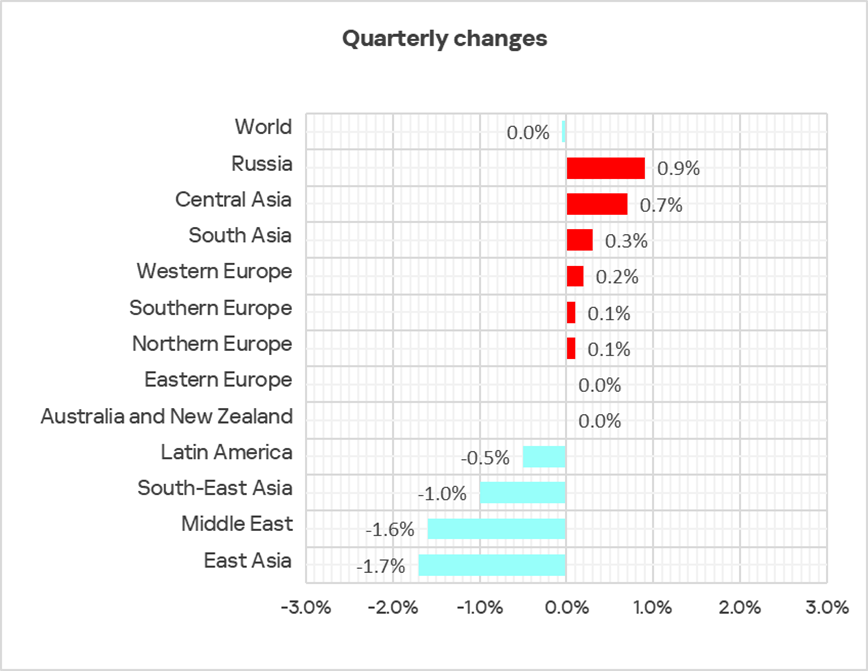
Compared to the previous quarter, the percentage of ICS computers on which malicious objects were blocked in Q1 2025 increased in six regions, most notably in Russia and Central Asia.
Threat sources
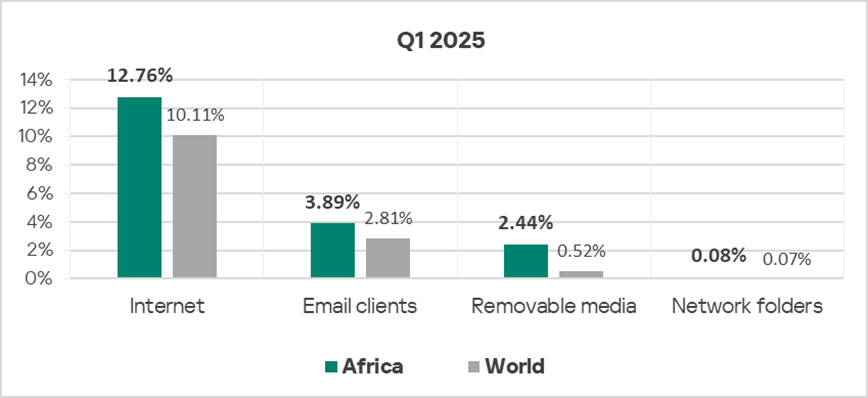
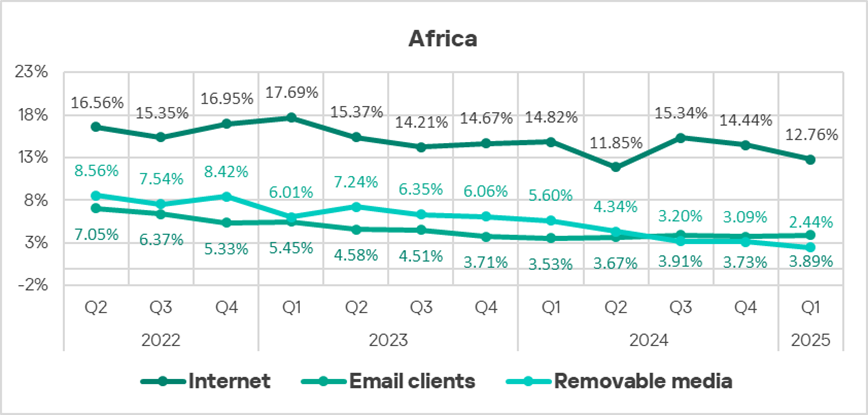
The internet (access to malicious or compromised web resources; malicious content distributed via messengers, cloud data storage and processing services, and CDNs), email clients (phishing emails), and removable media remain the primary sources of threats to computers in the OT infrastructure of organizations.
The internet ranks first among threat sources in all regions, followed by email in second place and removable media in third. Network folders rank lowest.
Internet
Whenever internet threats are detected and blocked on ICS computers protected by Kaspersky solutions, this indicates that those systems had access to external services at the time of detection.
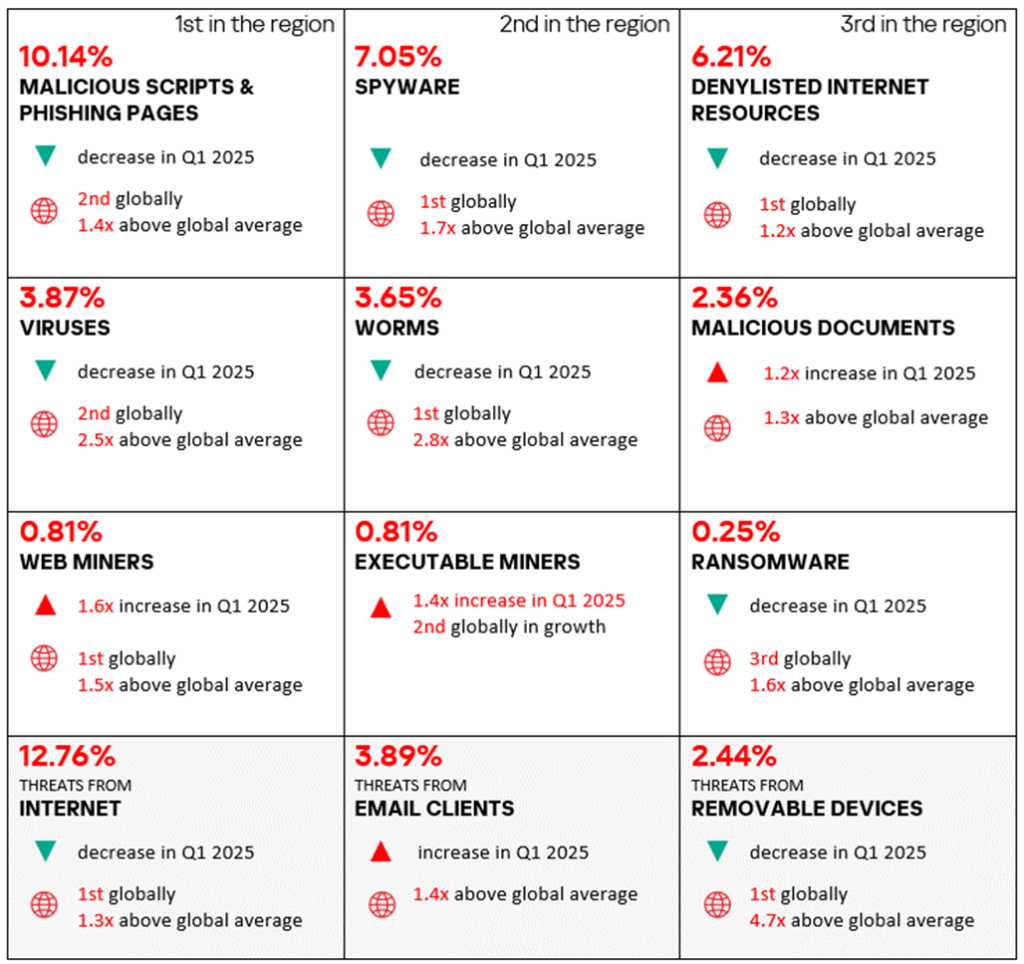
The main categories of internet threats blocked on ICS computers include denylisted internet resources, malicious scripts and phishing pages, web miners, and spyware.
Top three regions by percentage of ICS computers affected by this threat source in Q1 2025:
- Africa — 12.76%;
- South-East Asia — 12.32%;
- South Asia — 10.83%.
Apart from the top three regions, this threat source is particularly relevant to Russia (9.34%) and Central Asia (9.50%).
The lowest percentage was observed in Northern Europe — 5.24%.
The most significant increases in the percentage of ICS computers on which internet threats were blocked during the quarter were recorded in Russia (+1.29 p.p.), Central Asia (+1.04 p.p.), and Australia and New Zealand (+0.51 p.p.).
Email threats
Some of the threats that were detected and blocked had been delivered to protected computers via email systems and/or attempted to gain access through email client applications.
The main categories of email threats blocked on ICS computers include malicious documents, malicious scripts and phishing pages, and spyware.
Top three regions by percentage of ICS computers affected by threats from email clients in Q1 2025:
- Southern Europe — 6.76%;
- Middle East — 5.17%;
- Latin America — 4.55%.
The top three regions are invariable leaders in this ranking. Email also remains a significant source of threats in Eastern Europe (4.00%).
The lowest percentage was observed in Russia — 0.88%.
The most significant increases in percentages associated with this threat source in Q1 2025 were recorded in Australia and New Zealand (+0.35 p.p.), South Asia (+0.29 p.p.), and Southern Europe (+0.25 p.p.).
Removable media
Worms, viruses, and spyware are the main categories of threats blocked when removable devices are connected to ICS computers.
Most worms and viruses detected on removable media are either variants of outdated polymorphic threats (which first appeared around 2010) or modern modular cryptocurrency miners. These miners can spread across local networks by stealing credentials from infected hosts, exploiting known but as yet unpatched vulnerabilities, and performing brute-force attacks against network services.
Most spyware threats found on removable media were made up of universal components used in both modern and legacy worms, such as stealers, downloaders, and AV killers.
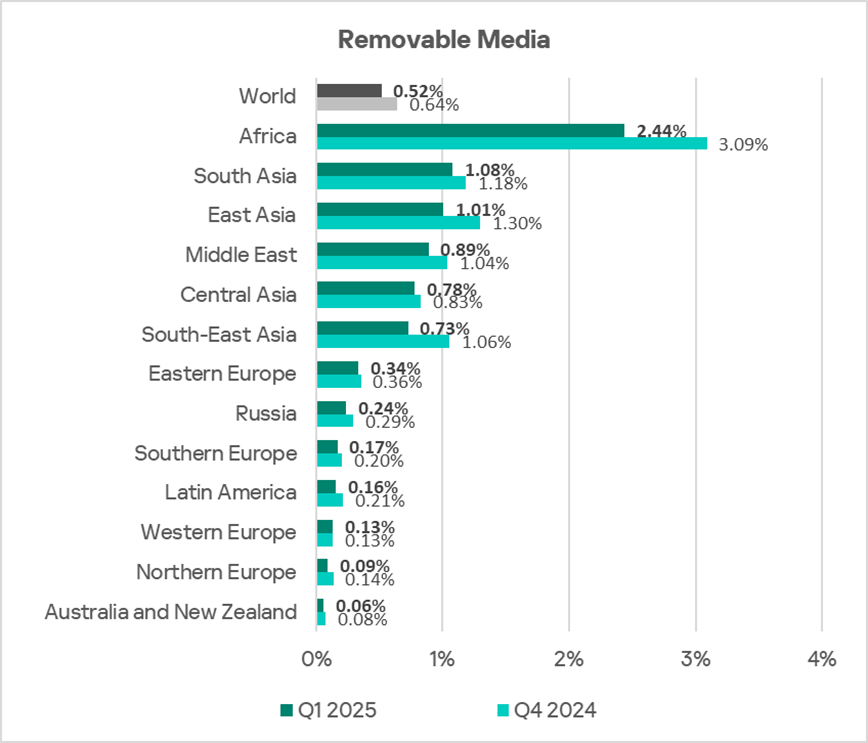
The top six positions in the ranking by percentage of ICS computers on which threats were blocked when connecting removable media are held by Africa, the Middle East (ranked fourth), and all regions of Asia.
Top three regions in Q1 2025 by this metric:
- Africa — 2.44%;
- South Asia — 1.08%;
- East Asia — 1.01%.
The lowest percentage was recorded in Australia and New Zealand — 0.06%.
The percentage of ICS computers affected by this threat source decreased across all regions in the first quarter.
Network folders
Network folders are a minor source of threats, through which worms, viruses, and malware for AutoCAD are distributed.
Top three regions by percentage of ICS computers affected by threats in network folders in Q1 2025:
- East Asia, the undisputed leader — 0.27%;
- South-East Asia — 0.16%;
- South Asia — 0.11%.
The lowest percentage was recorded in Australia and New Zealand — 0.01%.
As in the case of removable media, the issue of threats in network folders is typical for Asia, Africa, and the Middle East.
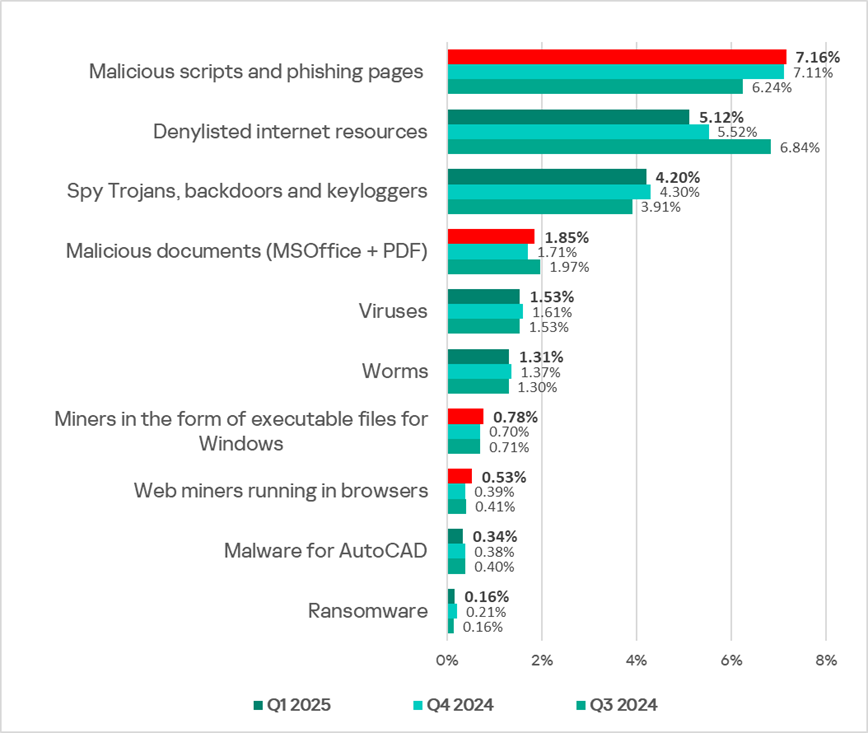
Malicious object categories
Malicious objects blocked by Kaspersky products on ICS computers can be broadly categorized into three groups based on their method of propagation and function:
- Malicious objects used for initial infection. These commonly include denylisted internet resources, malicious scripts and phishing pages, and malicious documents.
- Next-stage malware. This typically includes spyware, ransomware, and miners (Windows executables and web miners).
- Self-propagating malware. This group includes viruses and worms.
Malware for AutoCAD can spread in various ways, so we do not assign it to a specific group based on distribution method.
Malicious objects used for initial infection
The sources of most malicious objects used for initial infection are the internet and email.
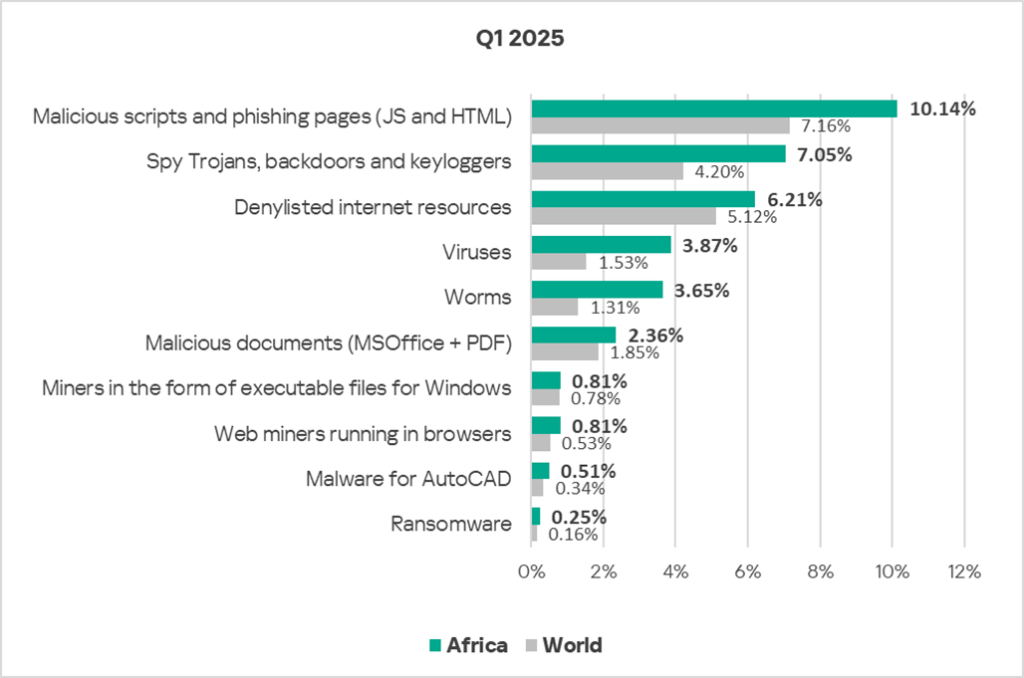
Globally, as well as in nearly all regions, denylisted internet resources, malicious scripts, and phishing pages lead the rankings of malicious object categories by the percentage of ICS computers on which they were blocked.
Denylisted internet resources
Cybercriminals use denylisted internet resources primarily as command-and-control (C2) infrastructure to distribute malware and conduct phishing attacks. Many such resources are used to deliver malicious scripts and phishing pages (HTML).
Top three regions by percentage of ICS computers on which denylisted internet resources were blocked:
- Africa — 6.21%;
- Russia — 5.60%;
- Central Asia — 5.50%.
The lowest percentage was observed in Northern Europe — 2.65%.
In Q1 2025, this parameter decreased across all regions except Russia (+0.33 p.p.), where it increased due to a new wave of attacks on websites built with outdated ASPRO templates for the Bitrix CMS.
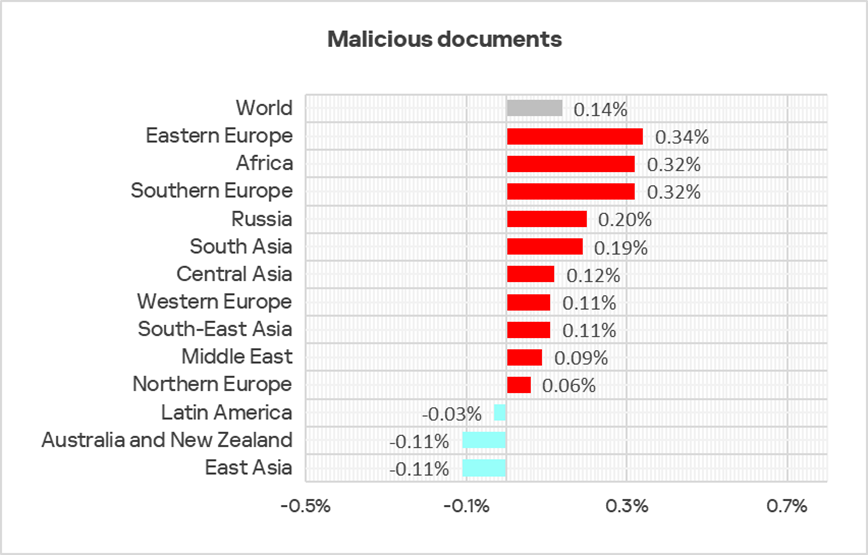
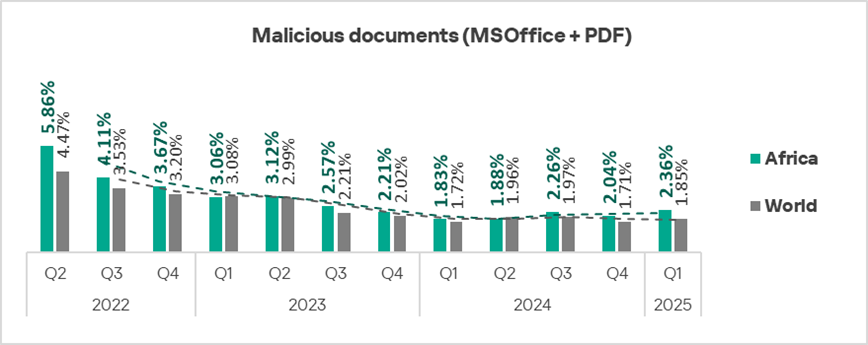
Malicious documents
Attackers distribute malicious documents in phishing emails and use them in attacks aimed at the initial infection of computers. Typically, malicious documents contain exploits, malicious macros, and harmful links.
Top three regions by percentage of ICS computers on which malicious documents were blocked:
- Southern Europe — 4.02%;
- Latin America — 3.30%;
- Middle East — 2.70%.
These same regions also lead the ranking by percentage of ICS computers on which email threats were blocked.
The lowest percentage for malicious documents was recorded in Northern Europe — 0.60%.
Globally, in Q1 2025, the percentage of ICS computers on which malicious documents were blocked increased by a factorof 1.1. This percentage increased in nearly all regions, with the top three regions by growth being Eastern Europe, Africa, and Southern Europe.
Malicious scripts and phishing pages
Attackers use malicious scripts to perform a broad range of tasks — from collecting data, tracking, and redirecting the user’s browser to a malicious web resource, to downloading various types of malware (such as spyware, programs for covert cryptocurrency mining, or ransomware) onto the system or into the user’s browser. Such scripts are distributed both via the internet and in emails.
Top three regions by percentage of ICS computers on which malicious scripts and phishing pages were blocked:
- Southern Europe — 10.31%;
- Africa — 10.14%;
- Middle East — 9.58%.
The lowest percentage was recorded in Northern Europe — 3.07%.
The top three regions by growth of this indicator were: Central Asia (+1.16 p.p.), Australia and New Zealand (+0.85 p.p.), and South Asia (+0.71 p.p.).
Next-stage malware
Malicious objects used for initial infection deliver next-stage malware to victims’ computers. This typically includes spyware, ransomware, and cryptocurrency miners. As a rule, the higher the percentage of ICS computers on which malware used for initial infection is blocked, the higher the corresponding percentage for next-stage malware.
Spyware
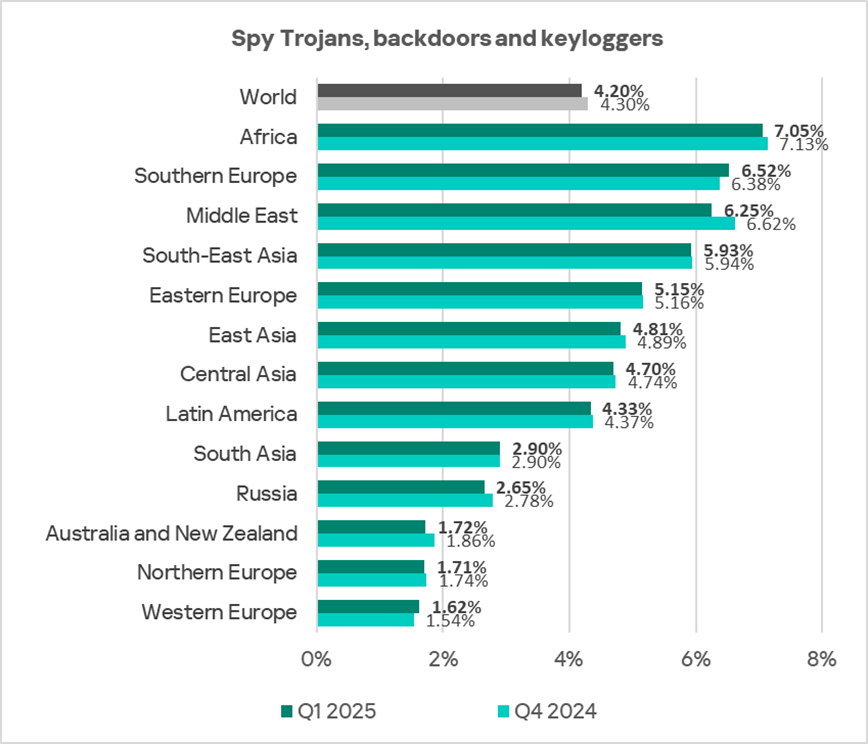
Spyware is used to steal information needed to deliver other types of malware, such as ransomware and malware for covert cryptocurrency mining, and to prepare targeted attacks.
In Q1 2025, the top three regions by percentage of ICS computers on which spyware was blocked included:
- Africa — 7.05%;
- Southern Europe — 6.52%;
- Middle East — 6.25%.
These regions also lead the ranking by percentage of ICS computers on which malicious scripts and phishing pages were blocked.
Spyware is also a relevant issue in East Asia (4.81%), where it tops the ranking of malware categories by percentage of ICS computers on which they were blocked.
In the top three regions, spyware ranks second among all categories of blocked threats. This is also the case in Eastern Europe (5.15%) and Latin America (4.33%).
The lowest percentage was recorded in Western Europe — 1.62%.
During the quarter, the percentage of ICS computers on which spyware was blocked increased in Southern Europe (+0.14 p.p.) and Western Europe (+0.08 p.p.).
Covert cryptocurrency mining programs
Q1 2025 saw a particularly noticeable increase in the global percentage of ICS computers on which miners were blocked:
- Web miners — up 1.4 times compared to the previous quarter;
- Miners in the form of executable files for Windows — up 1.1 times.
An increase in the percentage of ICS computers on which both categories of miners were blocked was recorded in nearly all regions.
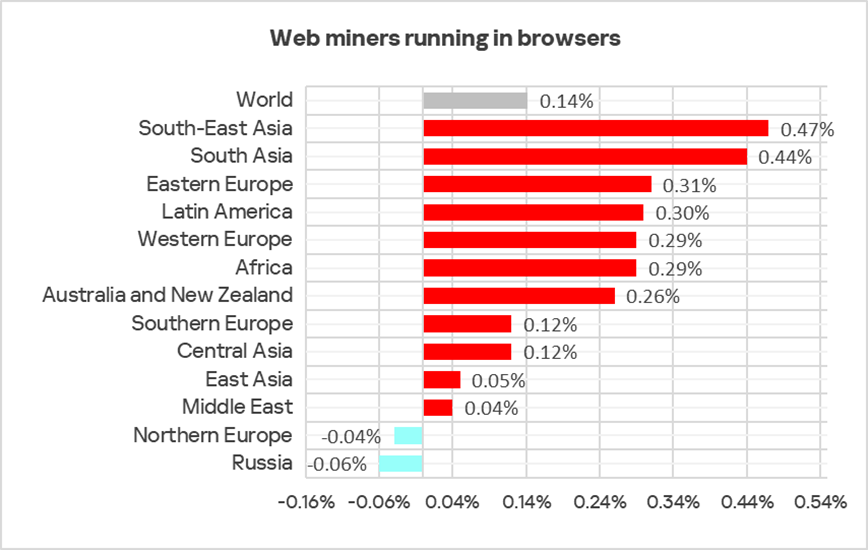
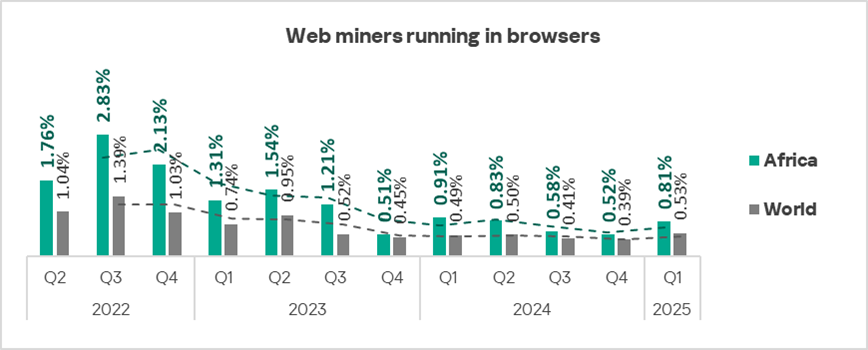
Web miners running in browsers
The top three regions by percentage of ICS computers on which web miners running in browsers were blocked were:
- Africa — 0.81%;
- South-East Asia — 0.80%;
- Eastern Europe — 0.76%.
The lowest percentage was recorded in East Asia — 0.18%.
In Australia and New Zealand, as well as Western Europe, web miners are higher in the ranking of blocked threat categories than globally: sixth place in the regional rankings versus eighth place in the global ranking.
In Q1 2025, the percentage of ICS computers on which web miners were blocked increased in all regions except Northern Europe and Russia. South-East Asia and South Asia were the regions with the most significant growth in this indicator.
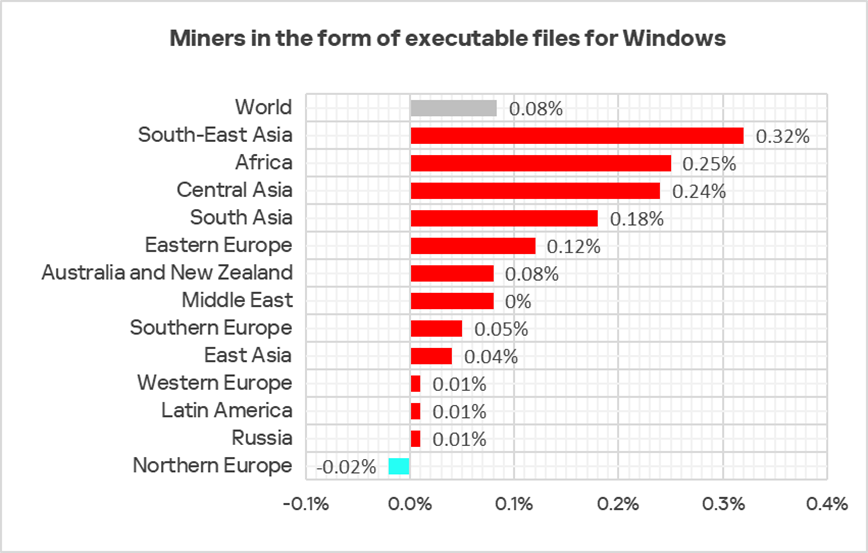
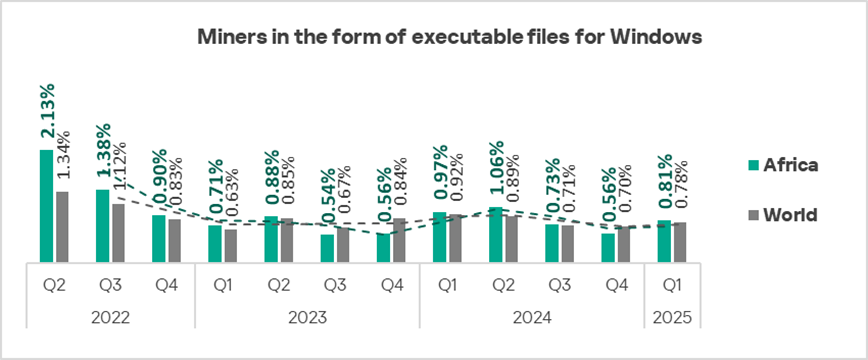
Miners in the form of executable files for Windows
The top three regions by percentage of ICS computers on which miners in the form of executable files for Windows were blocked:
- Central Asia — 1.72%;
- Russia — 1.04%;
- Eastern Europe — 0.85%.
The lowest percentage (0.20%) was recorded in Western Europe.
Miners in the form of executable files for Windows ranked seventh in the global ranking of threat categories by the percentage of ICS computers on which they were blocked. In the corresponding ranking for Russia, they ranked fourth, the highest position for this threat category among all regions.
In Q1 2025, this indicator increased in nearly all regions. The leading regions by growth were South-East Asia, Africa, and Central Asia.
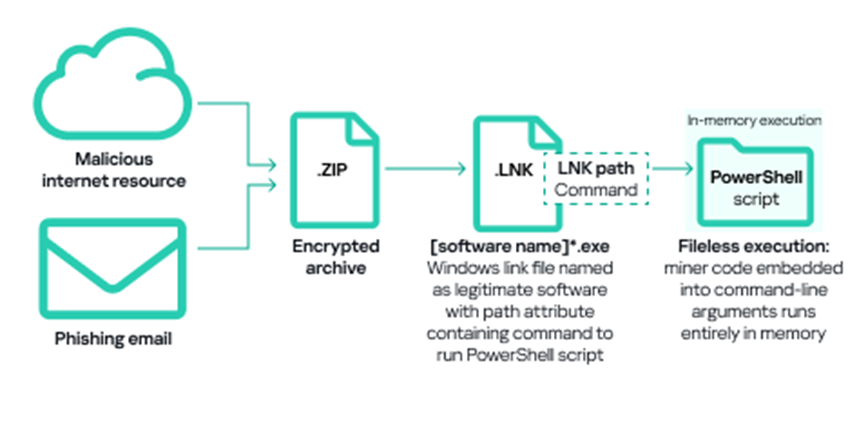
Alongside “classic” miners — applications written in .NET, C++, or Python and designed for covert cryptocurrency mining — attackers are adopting new techniques. Threat actors, including those deploying cryptocurrency miners on ICS computers, continue to use popular fileless execution methods.
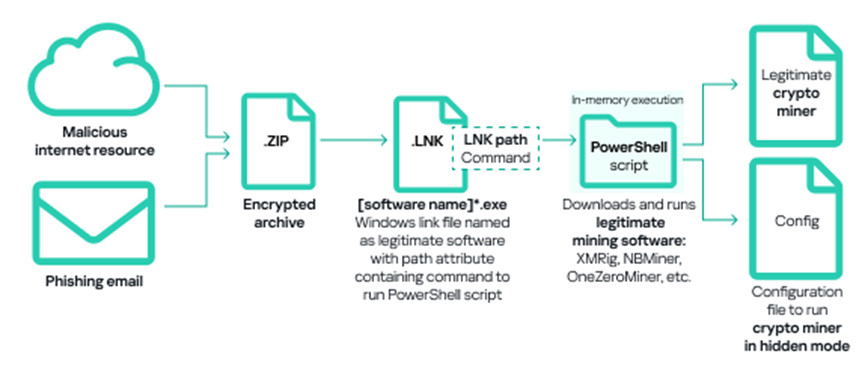
A significant part of the miners for Windows detected on ICS computers were archives with names mimicking legitimate software file names. These archives did not contain actual software, but included a Windows LNK file, more commonly known as a shortcut. However, the target (or path) referenced by the LNK file was not a regular application, but a command capable of executing malicious code, such as a PowerShell script. Threat actors increasingly use PowerShell to execute malicious code (including cryptocurrency miners) embedded in command-line arguments directly in memory, i.e., using a fileless approach. Fileless execution of miners helps minimize their detection by security solutions.
Another common method of deploying miners in OT infrastructure involves using legitimate cryptocurrency mining software such as XMRig, NBMiner, OneZeroMiner, and others. While these miners are not inherently malicious, they are classified as RiskTools by security systems. Attackers exploit these miners by combining them with customized configuration files that enable the miner’s activity to be concealed from the user’s view.
Ransomware
Top three regions by percentage of ICS computers on which ransomware was blocked:
- East Asia — 0.32%;
- Middle East — 0.30%;
- Africa — 0.25%.
The lowest percentage (0.08%) was recorded in Western Europe.
The top three regions by growth in this indicator were East Asia (+0.09 p.p.), Southern Europe (+0.07 p.p.), and Russia (+0.06 p.p.).
Self-propagating malware: worms and viruses
Self-propagating malware — worms and viruses — is classified as a separate category. Originally, worms and files infected with viruses were used for initial infection, but over time, as botnet functionality evolved, they acquired the characteristics of next-stage threats.
Worms
New versions of worms used by threat actors to distribute spyware, ransomware, and miners are found on ICS networks. In most cases, these worms exploit known vulnerabilities in network services (e.g., SMB, RDP) or use previously stolen authentication credentials or brute-force techniques.
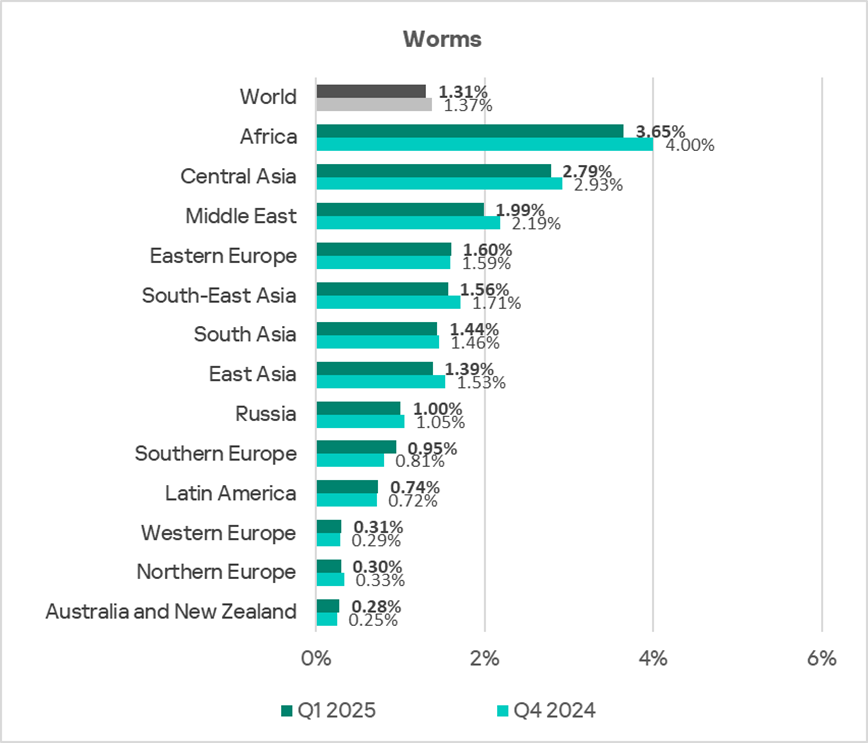
Top three regions by percentage of ICS computers on which worms were blocked:
- Africa — 3.65%;
- Central Asia — 2.79%;
- Middle East — 1.99%.
The lowest percentage (0.28%) was observed in Australia and New Zealand.
Globally, worms rank sixth among malware categories by percentage of ICS computers on which they were blocked. At the same time, in Central Asia’s regional ranking of threat categories, worms rank fourth — the highest position for this threat category in any regional ranking.
Southern Europe is the region with the highest quarterly growth of this indicator (+0.14 p.p.).
Viruses
Top three regions by percentage of ICS computers on which viruses were blocked:
- South-East Asia, a clear leader — 8.68%;
- Africa — 3.87%;
- East Asia — 2.85%.
South-East Asia leads this ranking by a significant margin. Viruses rank second among all malware categories in the region by percentage of ICS computers on which they were blocked. In other regional rankings, viruses do not rise above fourth place.
Two Asian regions from the top three also rank among the top three regions by percentage of ICS computers on which threats in network folders were blocked.
The lowest percentage (0.19%) was recorded in Australia and New Zealand.
The top three regions by growth in this indicator are Central Asia (+0.12 p.p.), Southern Europe (+0.09 p.p.), and South Asia (+0.06 p.p.).
AutoCAD malware
The top three regions ranked by percentage of ICS computers on which malicious AutoCAD programs were blocked are the same regions that top the virus ranking:
- South-East Asia — 2.65%;
- East Asia — 1.19%;
- Africa — 0.51%.
The percentage figures for East Asia and especially South-East Asia are significantly higher than those for other regions. These same regions also top the ranking of threats in network folders — again by a wide margin.
As a rule, malware for AutoCAD is near the bottom of rankings by percentage of ICS computers on which various categories of malicious objects were blocked. However, in East Asia and South-East Asia, it ranked notably higher:
- South-East Asia — fifth place;
- East Asia — seventh place.
The lowest percentage was recorded in Northern Europe — 0.01%.
Regions. Special considerations
To identify the distinctive characteristics of each region, you can compare its indicators with those of other regions and the global average statistics.
In most regions, as well as globally, top positions in rankings by percentage of ICS computers on which specific threat categories were blocked are occupied by malicious objects used for initial infection and spyware. As for the main sources of threats, the internet ranks first in all regions.
At the same time, there are certain regional characteristics and distinctions, which are discussed below.
Africa
Current threats
- Africa has for many years topped the ranking of regions by percentage of ICS computers on which malicious objects were blocked, with figures significantly exceeding the global averages – in Q1 2025, the percentage was 1.4 times higher than the global figure.
Self-propagating malware
- One of the characteristic issues in the region is self-propagating malware — worms and viruses. The percentage of ICS computers on which worms and viruses were blocked in Q1 2025 is significantly higher than the global average, 2.8 times and 2.5 times higher, respectively.
By percentage of ICS computers on which worms were blocked, Africa leads among all regions by a large margin, and the region ranks second in virus-related detections.
Apparently, high detection figures for self-propagating malware and malware distributed via network folders at the industry, country, or regional level typically mean that there is unprotected OT infrastructure that lacks even basic endpoint protection. These unprotected computers become sources of malware propagation. Contributing factors may also include poor enterprise network segmentation and a lack of controls on the use of removable media.
Although many of the spreading worms and viruses are old and their command-and-control servers have long been down, they not only weaken the security of infected systems, for example, by opening network ports or modifying configurations, but can also cause software malfunctions, denial of service, and other issues.
Worms and viruses spread in ICS networks via removable media, network folders, infected files (including backups), and network attacks on legacy software (e.g., Radmin2).
Threats from removable media
- Africa also leads by a large margin in terms of the percentage of ICS computers on which threats were blocked when connecting removable media. The percentage associated with this threat source in the region is 4.7 times higher than the global average.
Frequent attempts to infect protected systems when connecting USB drives may indicate:
- low connectivity in the organization’s OT network (a large number of remote sites not linked to the main network by high-speed and reliable communication lines);
- low level of enterprise IT infrastructure development (the absence of other standard internal systems for file storage and transfer);
- the presence of a significant unprotected part of the infrastructure that acts as a source of initial infection for removable drives;
- poor cybersecurity culture overall.
Spyware
- Another notable issue in the region is spyware, the rate of which also significantly exceeds the global average — by a factor of 1.7 in Q1 2025.
By percentage of ICS computers on which this threat is blocked, Africa leads the relevant ranking of all regions.
The detection of spyware on an ICS computer typically indicates that the initial infection vector worked, whether it was clicking a malicious link, opening an attachment in a phishing email, or connecting an infected USB drive. This points to the absence or ineffectiveness of OT network perimeter protection (such as monitoring the security of network communication and enforcing removable media usage policies).
Spyware is also used to steal information needed to deliver other malware, such as ransomware and tools for covert cryptocurrency mining, and to prepare targeted attacks.
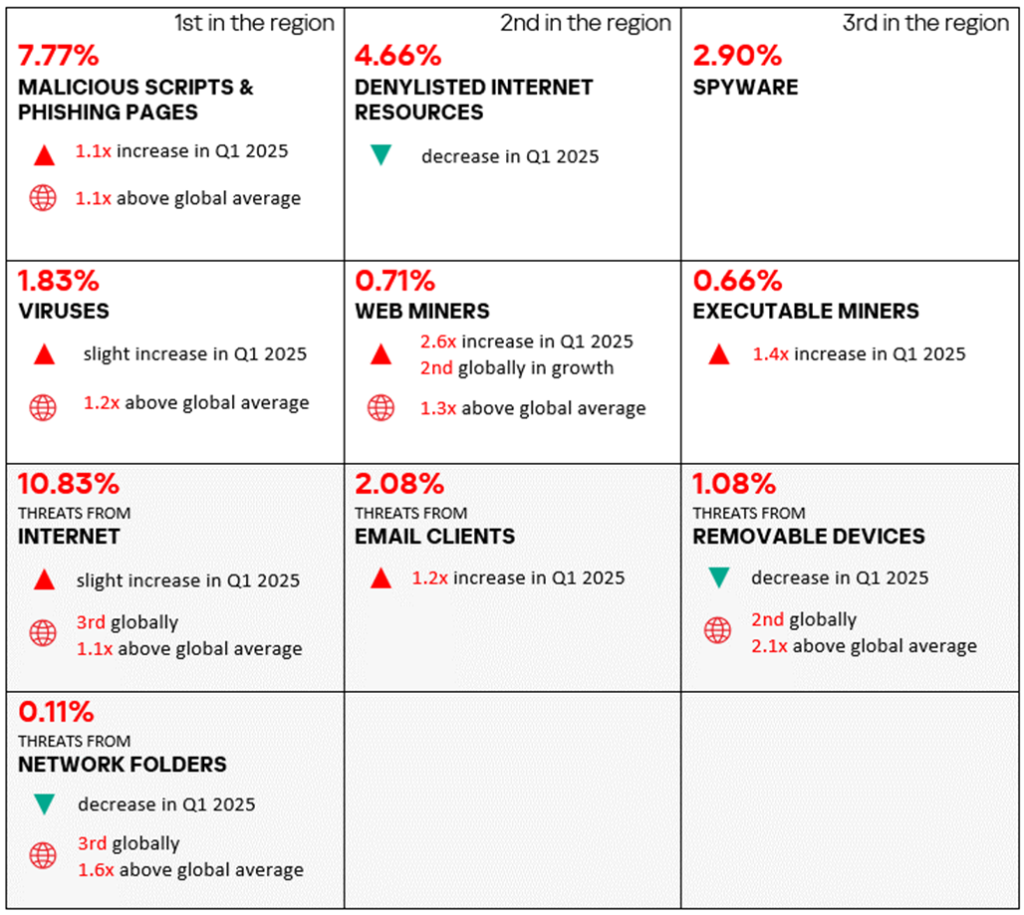
Overall
Africa traditionally ranks first globally by the percentage of ICS computers on which malicious objects were blocked. In Q1 2025, the percentage for the region was 29.6%. At the same time, the percentage of ICS computers on which malicious objects were blocked has decreased. The region exhibits a slight downward trend with fluctuations.
Comparative analysis
In Q1 2025, the percentage of ICS computers on which malicious objects were blocked in Africa was 1.4 times higher than the global average.
Threat categories
In Africa, the percentage of ICS computers on which malicious objects were blocked is higher than the global average for all threat categories.
The region had significantly higher, compared to the global average, percentages of ICS computers on which the following categories of malicious objects were blocked:
- Worms — 2.8 times higher;
- Viruses — 2.5 times higher;
- Spyware — 1.7 times higher;
- Ransomware — 1.6 times higher;
- Web miners — 1.5 times higher;
- Malicious programs targeting AutoCAD — 1.5 times higher;
- Malicious scripts and phishing pages — 1.4 times higher;
- Malicious documents — 1.3 times higher;
- Denylisted internet resources — 1.2 times higher.
These threat type percentage figures point to signs of low industrial enterprise cybersecurity maturity across the continent: the availability of internet resources on OT computers, poor protection against phishing, a significant proportion of unprotected infrastructure, and a relatively low level of cyber hygiene among personnel.
In Q1 2025, Africa ranked first among all regions by the percentage of ICS computers on which the following categories of malicious objects were blocked:
- Denylisted internet resources;
- Spyware;
- Worms;
- Web miners.
Africa ranked second among regions in the following categories:
- Viruses;
- Malicious scripts and phishing pages.
Threat sources
In Q1 2025, Africa ranked first among all regions by the percentage of ICS computers on which internet threats and threats from removable media were blocked.
The region’s percentage figures exceeded global averages for all threat sources:
- Removable media threats — by a factor of 4.7;
- Email threats — by a factor of1.4;
- Internet threats — by a factor of 1.3;
- Threats in network folders — by a factor of 1.1.
As we can see, the percentage for removable media is higher by a particularly large factor. For other threat sources, the difference is comparable to the overall difference in threat levels (by a factor of 1.4).
Quarterly changes and trends
Threat categories
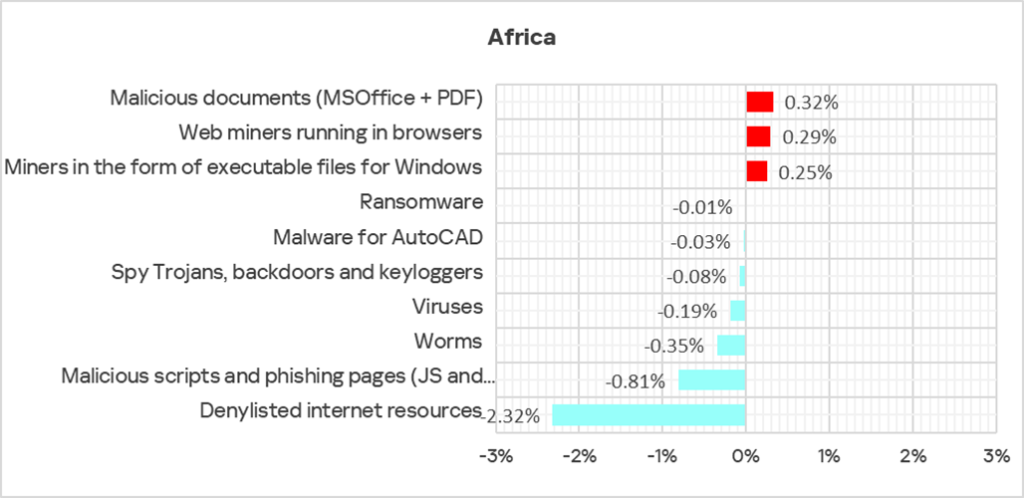
Q1 2025 saw increases in the percentage of ICS computers on which the following categories of malicious objects were blocked:
- Web miners — by a factor of 1.6.
- Miners in the form of executable files — by a factor of 1.4.
- Malicious documents — by a factor of 1.2.
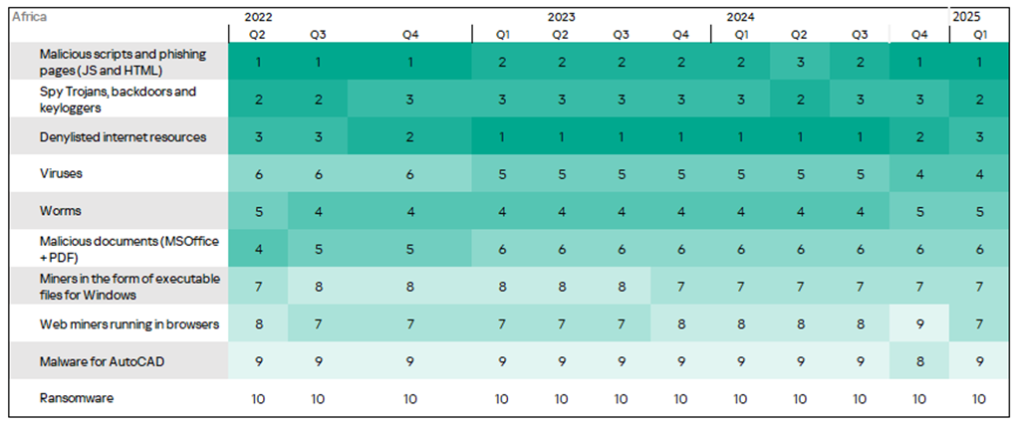
A heat map illustrates changes in the rankings of threat categories in Africa since Q2 2022. In Q1 2025, spyware moved up in the ranking from third to second place.
Threat sources
In Q1 2025, the percentage of ICS computers on which malicious objects were blocked decreased for all threat sources except email clients.
Industries
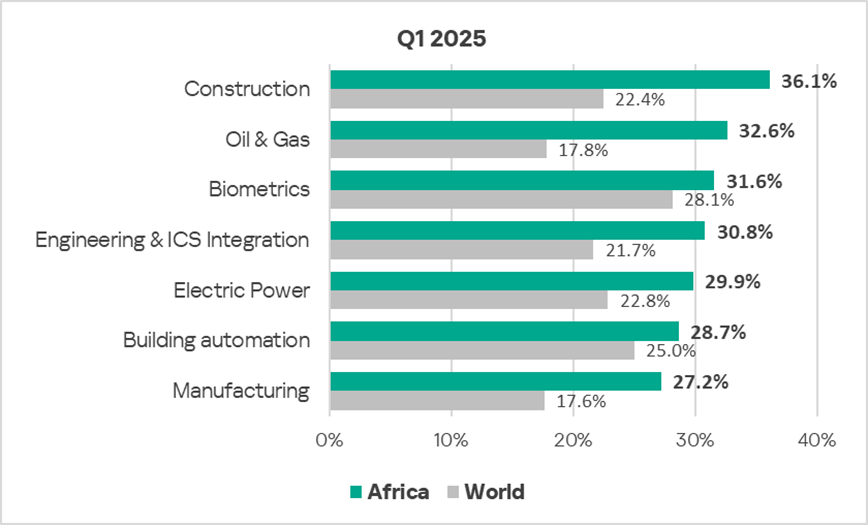
Construction remains the most frequently affected industry in the region among those covered in the report.
In all industries analyzed, the percentage of ICS computers in the region on which malicious objects were blocked was higher than the corresponding global averages. The most significant differences were observed in the following industries:
- Oil and gas — 1.8 times higher;
- Construction — 1.6 times higher;
- Manufacturing — 1.5 times higher;
- Engineering and ICS integrators — 1.4 times higher;
- Electric power sector — 1.3 times higher.
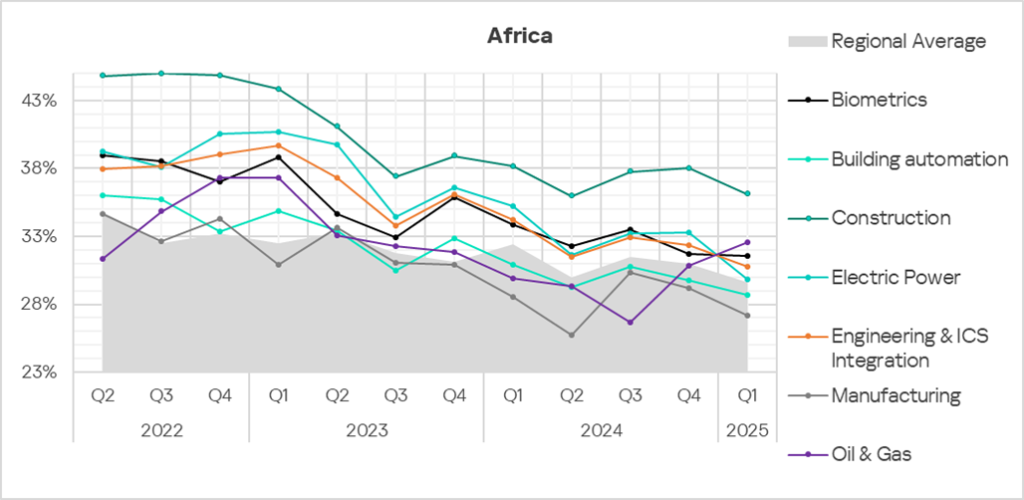
One of the general conclusions that can be made from years of monitoring the accessibility of OT infrastructures to threats is that the rate at which cybersecurity measures and tools are implemented typically lags behind the pace of industry development. When commissioning a facility, cybersecurity considerations are often an afterthought. As a result, the security tools are inadequate, the personnel are poorly trained, and the security policies are not consistently enforced.
This trend can be clearly traced in statistics for industries and infrastructure types in Africa. Oil and gas, energy, manufacturing, and construction are all rapidly developing sectors, with engineering evolving as a support sector.
In Q1 2025, the percentage of ICS computers on which malicious objects were blocked increased only in the oil and gas sector. The percentage has now grown for the second consecutive quarter, causing the oil and gas sector to rise in the industry ranking from last (seventh) place to second.
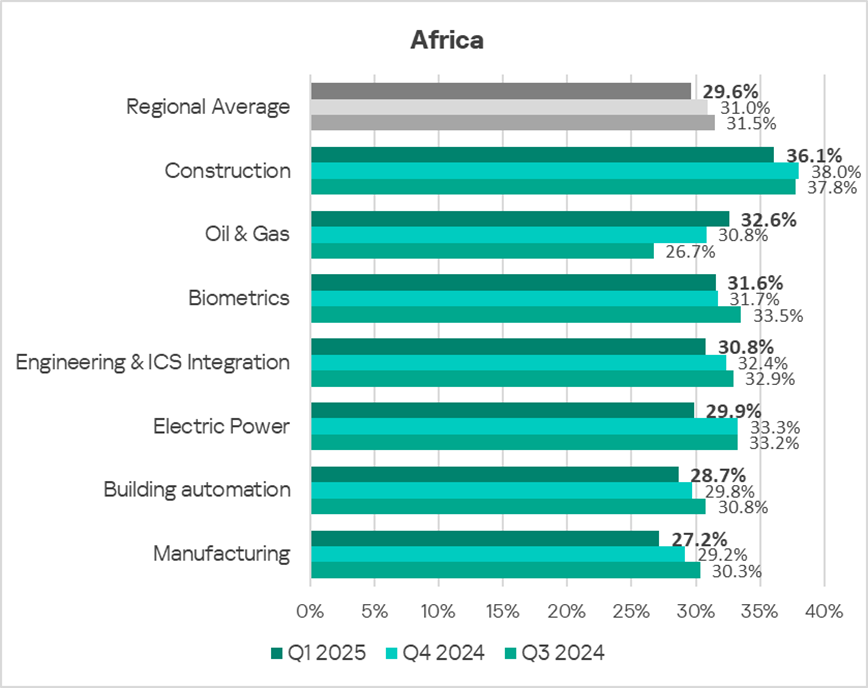
The selected industries show positive dynamics in their long-term trends (declining indicators), with occasional major fluctuations.
South-East Asia
Current threats

- South-East Asia ranks second globally by the percentage of ICS computers on which threats in network folders were blocked. The regional percentage figure is 2.3 times higher than the global average.
- In South-East Asia, viruses rank second in the regional malware category ranking by percentage of ICS computers on which they were blocked. This is the highest position for viruses among all regional rankings. The percentage for the region is 5.7 times higher than the global average and is the highest in the world.

Apparently, high percentage figures for self-propagating malware and threats in network folders indicate that a significant part of the infrastructure is unprotected, becoming a source of secondary malware infections (malware propagation), and point to a lack of segmentation in enterprise networks in the region.
- The region also shows an unusually high percentage for AutoCAD malware. Globally, the percentage of ICS computers on which this type of malware was blocked is among the lowest across all categories. At the same time, in the regional ranking it is in fifth place, with a percentage that’s 7.8 times higher than the global average and is the highest in the world.

In most cases, malware for AutoCAD is distributed in the same way as viruses. This explains the high percentage for this malware category in the region.
Overall
South-East Asia ranks second globally by percentage of ICS computers on which malicious objects were blocked, with 29.1%. This figure has consistently exceeded the global average.

Comparative analysis
In Q1 2025, the percentage of ICS computers on which malicious objects were blocked in South-East Asia was 1.3 times higher than the global average.
Threat categories
For most threat categories, the percentage of ICS computers in the region on which malicious objects were blocked exceeds the global average.

Compared to global figures, the region has significantly higher percentages of ICS computers on which the following categories of malicious objects were blocked:
- Malicious programs for AutoCAD — 7.8 times higher;
- Viruses — 5.7 times higher;
- Web miners — 1.5 times higher;
- Spyware — 1.4 times higher.
In Q1 2025, South-East Asia ranked first among all regions by percentage of ICS computers on which the following malicious objects were blocked:
- Viruses;
- Malware for AutoCAD.
Threat sources
For all threat sources, the percentage of ICS computers in the region on which malicious objects were blocked exceeds the global average:
- Threats in network folders — by a factor of 2.3;
- Threats from email clients — by a factor of 1.4;
- Threats from removable media — by a factor of 1.4;
- Internet threats — by a factor of 1.2.

Quarterly changes and trends
Threat categories

The largest quarter-over-quarter increases were observed in the percentage of ICS computers on which the following malicious objects were blocked:
- Web miners — by a factor of 2.4. South-East Asia ranked first in the world by growth in this category.

- Miners in the form of executable files for Windows, by a factor of 1.8. The region also ranked first globally by growth in this category.

A heat map illustrates changes in the rankings of threat categories in South-East Asia since Q2 2022. In Q1 2025, spyware rose from fourth to third place, and web miners moved up from ninth to eighth.

Threat sources
In Q1 2025, the percentage of ICS computers on which malicious objects were blocked decreased for all threat sources, except email.

Industries
The industries in the region that are most frequently affected by threats, among those analyzed in this report, are construction and building automation, which, apparently, also reflects the pace at which industrial sectors have been developing in the region (with the rate at which cybersecurity measures and tools are implemented typically lagging behind the speed at which the industry is growing).
Compared to corresponding global averages, a higher percentage of ICS computers on which malicious objects were blocked was observed in the following industries:
- Construction — 1.5 times higher;
- Manufacturing — 1.3 times higher;
- Building automation — 1.2 times higher;
- Electric power — 1.2 times higher;
- Engineering and ICS integrators — 1.2 times higher.

In Q1 2025, an increase in the percentage of ICS computers on which malicious objects were blocked was observed only in the construction and manufacturing sectors.

Trends in the selected industries generally show a positive trajectory, although they are accompanied by sharp fluctuations and extended periods of slow growth or decline.

Central Asia
Current threats

- In Central Asia, the percentage of ICS computers on which threats were blocked when connecting removable media has traditionally been high. In Q1 2025, this indicator was 1.5 times higher than the global average.
- The region also has above-average levels of threats distributed via network folders.
These two issues typically result in high percentage figures for self-propagating threats. - In Q1 2025, the percentage of ICS computers on which worms were blocked in the region was 2.1 times higher than the global average.
Based on this indicator, Central Asia ranked second among all regions, behind Africa. - By growth in the percentage of ICS computers on which viruses were blocked, Central Asia ranked first globally in Q1 2025.
- Another threat characteristic of the region is cryptocurrency miners in the form of executable files for Windows. In Q1 2025, the percentage of ICS computers on which such miners were blocked was 2.2 times higher than the global average.
Central Asia ranked first among all regions based on this indicator.

A small research project revealed that cryptocurrency mining software is, apparently, often installed on ICS computers in the region by legitimate users. However, in many cases, employees download such software from the internet without realizing that its configuration has been altered by threat actors, resulting in mining profits being redirected to parties other than the users who installed the software.
It should also be kept in mind that many families of such malware include functionality for credential theft and self-propagation over the network (as mentioned above), which means that the presence of such software on an OT network should by no means be considered a minor threat.
Overall
Central Asia ranked third globally by the percentage of ICS computers on which malicious objects were blocked. The region ranked fourth in the previous quarter.
In Q1 2025, the regional percentage slightly increased to 24.2%.

Comparative analysis
The region’s percentage remains above the global average, although a trend indicating a narrowing of the gap is being observed.
Threat categories

Compared to global averages, Central Asia has higher percentages of ICS computers on which the following categories of threats were blocked:
- Worms — 2.1 times higher. In Central Asia, worms rank fourth in the regional ranking of threat categories — this is the highest position for worms across all regional rankings;
- Miners in the form of executable files for Windows — 2.2 times higher;
- Ransomware — 1.3 times higher;
- Denylisted internet resources — 1.1 times higher;
- Spyware — 1.1 times higher.
In regional rankings in Q1 2025, Central Asia demonstrated the following results:
- First place by percentage of ICS computers on which miners in the form of executable files for Windows were blocked;
- Second place by percentage of ICS computers on which worms were blocked;
- Third place by percentage of ICS computers on which denylisted internet resources were blocked.
Threat sources
In Q1 2025, Central Asia exceeded global averages in the percentage of ICS computers on which the following malicious objects were blocked:
- Threats from removable media — by a factor of 1.5;
- Threats in network folders — by a factor of 1.1.

Quarterly changes and trends
Threat categories

Central Asia ranked first among all regions by growth in the percentage of ICS computers on which malicious scripts and phishing pages were blocked and second in the percentage for viruses.
The greatest quarter-over-quarter increases in the region were observed in percentages of ICS computers on which the following categories of malicious objects were blocked:
- Web miners — by a factor of 1.4.

- Malicious scripts and phishing pages — by a factor of 1.3.

- Miners in the form of executable files for Windows — by a factor of 1.2.

- Viruses — by a factor of 1.1.

A heat map illustrates changes in threat category rankings in Central Asia since Q2 2022. In Q1 2025, malicious scripts and phishing pages rose from third to second place in the ranking.

Threat sources
In Q1 2025, the percentage of ICS computers on which malicious objects were blocked increased for two threat sources:
- Internet threats — by a factor of 1.1;
- Email threats — by a factor of 1.1.

Industries
Among the selected industries in the region analyzed in this report, the OT infrastructure in the biometric and building automation industries face cyberthreats most frequently.
The regional indicator exceeded the global average in the following industries:
- Biometrics and electric power — by a factor of 1.2;
- Building automation, engineering and ICS integrators — by a factor of 1.1.

The largest quarterly increase was observed in the OT infrastructure of the biometric system industry, where the indicator grew by a factor of 1.1.

Trends across all industries show positive dynamics (declining indicators) overall. An exception to this is the biometric system industry, where the indicator has been growing since Q3 2024.

Middle East
Current threats

- In the Middle East, the percentage of ICS computers on which the following threats were blocked is significantly above the global averages:
- Email threats — by a factor of 1.8;
- Removable media threats — by a factor of 1.7.
- The Middle East ranks second among all regions by the percentage of ICS computers on which email threats were blocked. The region’s percentage figure for malicious documents is 1.5 times higher than the global average.
- One of the main threats delivered via malicious documents is spyware. In the Middle East, the percentage of ICS computers on which spyware was blocked is 1.5 times higher than the global average, as in the case of malicious documents.
This malware distribution scheme is reflected in our statistics.

Threat actors use spyware to steal confidential data. In targeted attacks, it is also used for lateral movement within the victim’s network and to deliver final-stage malware. In some cases, spyware infections result in the installation of ransomware on victim computers.
- The percentage of ICS computers on which ransomware was blocked in the Middle East remains consistently high. The percentage figure for ransomware in the region is nearly double the global average.
In Q1 2025, the Middle East ranked second among regions by percentage of ICS computers on which ransomware was blocked (notably, the region was in top position in 2024).
Overall
The Middle East ranks fourth globally by percentage of ICS computers on which malicious objects were blocked. This percentage has consistently exceeded the global average.
In Q1 2025, the percentage of ICS computers on which malicious objects were blocked in the Middle East decreased to 24.1%.

A general analysis indicates there is a high risk of targeted attacks. High percentages for email threats (phishing), spyware, and ransomware clearly indicate that OT systems in the region are highly exposed to advanced threat actors.
Comparative analysis
In Q1 2025, the regional percentage was 1.1 times higher than the global average.
Threat categories
In the Middle East, the percentage of ICS computers on which malicious objects were blocked is above the global averages for all threat categories, except denylisted internet resources, miners in the form of executable files for Windows, and malware for AutoCAD.

The high risk of targeted attacks on industrial infrastructures in the region (see above) is further underscored by the high percentage associated with malicious scripts and phishing pages, many of which are specifically designed to steal employee authentication credentials for corporate services.
At the same time, the relatively high percentage figures associated with self-propagating malware point to a significant part of the infrastructure not being protected against malware, and to insufficient network segmentation.
The greatest differences in regional percentages compared to the global averages were observed for the following threat categories:
- Ransomware — 1.9 times higher, second place among all regions;
- Worms — 1.5 times higher, third place among all regions;
- Spyware — 1.5 times higher, third place among all regions;
- Malicious documents — 1.5 times higher, third place among all regions;
- Malicious scripts and phishing pages — 1.3 times higher, third place among all regions;
- Viruses — 1.3 times higher.
Threat sources
In the Middle East, the percentages of ICS computers on which the following threats were blocked significantly exceed global averages:
- Email threats — 1.8 times higher;
- Threats on removable media — 1.7 times higher.
The Middle East ranked second among all regions in Q1 2025 by percentage of ICS computers on which email threats were blocked.

Quarterly changes and trends
Threat categories
During Q1 2025, the percentage of ICS computers on which malicious objects were blocked increased across four threat categories.

The largest quarter-over-quarter increase of 1.2 times was observed in the percentage of ICS computers on which miners in the form of executable files for Windows were blocked.

Increases were also recorded in the following categories:
- Web miners — by a factor of 1.1.

- Ransomware — by a factor of 1.1.

- Malicious documents.

A heat map illustrates changes in the threat category rankings in the Middle East since Q2 2022. In Q1 2025, viruses went up from sixth to fifth place, ransomware rose from tenth (last) place to ninth.

Threat sources
In Q1 2025, the percentage of ICS computers on which malicious objects were blocked decreased across all threat sources.

Industries
Among the industries analyzed in this report, building automation is the most frequently affected by threats in the region.
The percentage of ICS computers on which malicious objects were blocked exceeds global averages most significantly in the following industries:
- Electric power sector — by a factor of 1.2;
- Construction — by a factor of 1.1;
- Building automation — by a factor of 1.1.

In Q1 2025, the percentage of ICS computers on which malicious objects were blocked decreased across all selected industries.

Despite periodic fluctuations, the trends across the examined industries show positive dynamics overall.

Eastern Europe
Current threats

- In Eastern Europe, the percentage of ICS computers on which malicious objects from email clients were blocked significantly exceeds the global average. In Q1 2025, the regional percentage was higher than the global average by a factor of 1.4. Eastern Europe ranks fourth among regions by this indicator.
- Email clients are the primary source used to distribute malicious documents. In the region, the percentage figure for this threat category is 1.3 times higher than the global average. Eastern Europe also ranks fourth among regions based on this indicator (as in the case of email clients).
In Q1 2025, the percentage of ICS computers on which malicious documents were blocked increased by a factor of 1.2, making Eastern Europe the leader among all regions in terms of growth for this category. - Threat actors use malicious documents to deliver targeted malware, such as spyware and ransomware. The percentage of ICS computers on which ransomware was blocked in the region increased in Q1 2025 by a factor of 1.3.
Overall
In Q1 2025, Eastern Europe rose from sixth to fifth place in the global ranking of regions by percentage of ICS computers on which malicious objects were blocked. Prior to Q2 2023, the region had not risen above ninth place in the ranking.
In Q1 2025, the figure remains unchanged at 21.8% and is only slightly different from the global average.

Comparative analysis
Threat categories

Compared to global averages, the region has a noticeably higher percentage of ICS computers on which the following threat categories were blocked:
- Web miners — by a factor of 1.4;
- Malicious documents — by a factor of 1.3;
- Spyware — by a factor of 1.2;
- Worms — by a factor of 1.2;
- Malicious scripts and phishing pages — by a factor of 1.1;
- Miners in the form of executable files for Windows — by a factor of 1.1.
Eastern Europe ranks third among all regions based on the percentage of ICS computers on which both categories of miners were blocked.
Threat sources
As in the previous quarter, the level of threats from email clients in the region remains above the global average — in Q1 2025, by a factor of 1.4. Eastern Europe ranks fourth among regions based on this indicator.

Quarterly changes and trends
Threat categories

The highest quarter-over-quarter growth was observed in the percentage of ICS computers on which the following malicious objects were blocked:
- Web miners — by a factor of 1.7. The region ranked third globally based on this indicator.

- Ransomware — by a factor of 1.3.

- Malicious documents — by a factor of 1.2. Eastern Europe ranked first among all regions based on the growth of this percentage.

- Miners in the form of executable files for Windows — by a factor of 1.2. The region ranked third globally based on this indicator.

A heat map illustrates changes in threat category rankings in Eastern Europe since early 2022. In Q1 2025, spyware rose from third to second place in the ranking.

Threat sources
In Q1 2025, the percentage of ICS computers on which malicious objects from all threat sources were blocked increased slightly for internet threats only.

Although the percentage of ICS computers on which threats from email clients were blocked decreased in Q1 2025, it still remains significantly, by a factor of 1.4, above the global average.

Industries
Among the selected industries, building automation is the most frequently affected by threats in the region. It was the only industry in the region with a percentage slightly above the global average.

In Q1 2025, the largest increase in the percentage of ICS computers on which malicious objects were blocked – by a factor of 1.3 – was observed in the oil and gas sector.

Trends across the industries analyzed indicate a stabilization following a significant rise in 2022.

South Asia
Current threats
- South Asia ranks second globally by the percentage of ICS computers on which removable media threats were blocked. The region’s percentage figure is 2.1 times higher than the global average.
- South Asia ranks third among all regions by the percentage of ICS computers on which threats in network folders were blocked. The indicator for this threat source is 1.6 times higher than the global average.
Removable media and network folders often serve as channels for the distribution of self-propagating malware. - Viruses rank fourth in the region’s ranking of blocked malicious object categories. In all other regions, with the exception of Africa, East Asia, and South-East Asia, viruses do not rise above the fifth position in the equivalent rankings.
Overall
In Q1 2025, South Asia rose from eighth to sixth place in the global ranking by percentage of ICS computers on which malicious objects were blocked.
At the same time, the percentage for the region decreased to 21.0%.
The region exhibits a gradual downward trend with some fluctuations. Since the previous quarter, South Asia’s percentage has been below the global average.

Comparative analysis
Threat categories

Compared to global averages, the region showed noticeably higher percentages of ICS computers on which the following threat categories were blocked:
- Web miners — by a factor of 1.3;
- Viruses — by a factor of 1.2;
- Malicious scripts and phishing pages — by a factor of 1.1;
- Worms — by a factor of 1.1.
Threat sources
South Asia ranks second globally by the percentage of ICS computers on which removable media threats were blocked, with a percentage 2.1 times higher than the global average. In the previous quarter, the region was in third place in this ranking.
Additionally, the region ranks third among all regions by the percentage of ICS computers on which threats in network folders were blocked, with a percentage 1.6 times higher than the global average.

Quarterly changes and trends
Threat categories

The largest growth over the previous quarter in South Asia was recorded for the percentages of ICS computers on which the following malicious objects were blocked:
- Web miners — by a factor of 2.6. The region ranked second globally by growth in this threat category.

- Miners in the form of executable files for Windows — by a factor of 1.4.

- Malicious documents — by a factor of 1.2.

- Malicious scripts and phishing pages — by a factor of 1.1.

A heat map illustrates changes in threat category rankings in South Asia since Q2 2022. In Q1 2025, web miners rose from ninth to seventh place in the ranking.

Threat sources
Among threat sources in Q1 2025, the percentage of ICS computers on which malicious objects were blocked increased slightly for internet threats and by a factor of 1.2 for threats from email clients.

The level of threats from removable media continues to exhibit a downward trend, although it still remains above the corresponding global average.

Industries
Biometrics continue to lead among the selected sectors and OT infrastructures.
The percentage of ICS computers on which malicious objects were blocked was below the global average in all selected sectors, except manufacturing.

In Q1 2025, an increase in the percentage of ICS computers on which malicious objects were blocked was observed in all selected sectors in the region, except engineering and ICS integrators, and manufacturing.

The selected industries generally exhibit positive dynamics of long-term trends, albeit with significant fluctuations.

East Asia
Current threats

- East Asia is the only region where spyware ranks top among malware categories by percentage of ICS computers on which different threat categories were blocked.
When spyware is detected on an ICS computer, this typically indicates that an initial infection vector was successful, whether it was clicking a malicious link, opening an attachment in a phishing email, or connecting an infected USB drive. This points to the absence or ineffectiveness of perimeter protection measures (such as monitoring the security of network communication and enforcing removable media usage policies).
Spyware is used to steal information needed to deliver other types of malware, such as ransomware and malware for covert cryptocurrency mining, and to prepare targeted attacks.
Spyware is also often used to install ransomware on infected computers.
- East Asia leads the ranking of all regions by percentage of ICS computers on which ransomware was blocked, with a percentage that is twice the global average. In Q1 2025, the region also ranked first based on the growth of this indicator.

- East Asia ranks third globally based on the percentage of ICS computers on which threats were blocked when connecting removable media. For comparison, the region ranks 11th for internet threats and 10th for email threats in the corresponding regional rankings.
- In addition, East Asia ranks first for another threat source, network folders.

- Network folders are typically used to spread viruses and malware for AutoCAD. The region’s percentages for both categories significantly exceed global averages – by a factor of 1.9 and 3.5, respectively.
In Q1 2025, East Asia ranked third among all regions by percentage of ICS computers on which viruses were blocked, and second by the same percentage for AutoCAD malware.
Overall
East Asia ranks seventh globally by percentage of ICS computers on which malicious objects were blocked.
The region exhibits a downward trend with fluctuations.
In Q1 2025, after a noticeable increase in the previous quarter, the percentage of ICS computers on which malicious objects were blocked decreased to 21.0%.

Comparative analysis
Threat categories
East Asia is the only region where spyware tops the ranking of threat categories.

Compared to global averages, the region has significantly higher percentages of ICS computers affected by the following categories of malicious objects:
- AutoCAD malware — by a factor of 3.5;
- Ransomware — by a factor of 2;
- Viruses — by a factor of 1.9;
- Worms — by a factor of 1.1;
- Spyware — by a factor of 1.1.
In Q1 2025, East Asia ranked among all regions:
- First by percentage of ICS computers on which ransomware was blocked;
- Second by percentage of ICS computers on which AutoCAD malware was blocked;
- Third by percentage of ICS computers on which viruses were blocked.
Threat sources
East Asia continues to rank first among all regions by the percentage of ICS computers on which threats were blocked in network folders. In Q1 2025, the region’s percentage was 3.9 times higher than the global average.
The percentage of ICS computers on which removable media threats were blocked was 1.9 times higher than the global average. Based on this indicator, the region ranks third globally.

Quarterly changes and trends
Threat categories

The highest increases over the previous quarter were observed in Q1 2025 in the percentage of ICS computers on which the following categories of malicious objects were blocked:
- Ransomware — by a factor of 1.4, with East Asia ranking first among regions based on growth in this category.

- Web miners — by a factor of 1.4.

- Miners in the form of executable files for Windows — by a factor of 1.2.

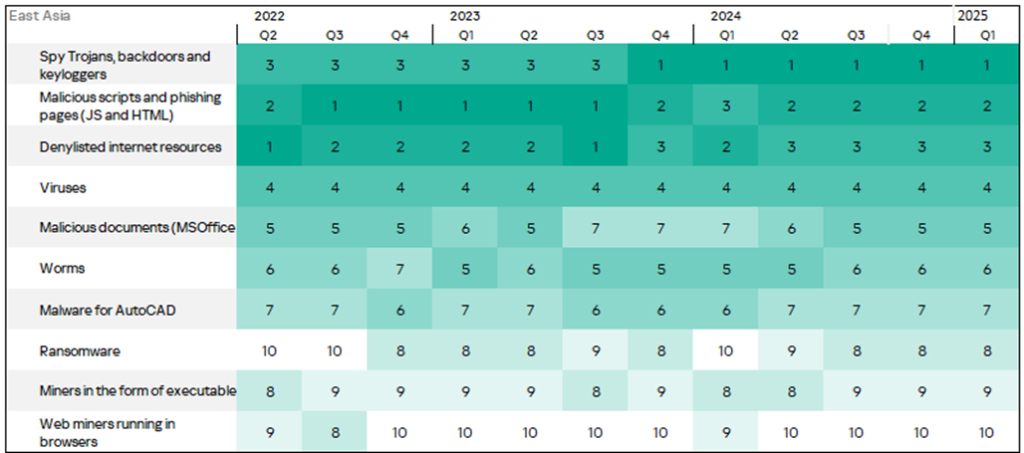
A heat map illustrates changes in threat category rankings in East Asia since Q2 2022. In Q1 2025, the positions of all threat categories remained unchanged.
Threat sources
Overall, all major threat sources are showing a downward tendency in their long-term trends.

At the same time, in Q1 2025, the level of email threats in East Asia increased by a factor of 1.1.

The percentage of ICS computers in East Asia on which threats were blocked in network folders continues to exhibit a downward trend. However, this percentage remains well above the global average and is still the highest among all regions.

Industries
Among the industries selected for this report, the electric power sector is the most frequently affected by threats in the region.
Compared to the corresponding global averages, the following industries in East Asia showed higher percentages of ICS computers on which malicious objects were blocked:
- Electric power sector — by a factor of 1.3;
- Construction — by a factor of 1.1;
- Manufacturing — by a factor of 1.1.

In Q1 2025, a decrease in the percentage of ICS computers on which malicious objects were blocked was recorded in all industries.

East Asia is the world’s largest consumer of electricity. Power consumption — and thus generation — in the region has been growing almost continuously. Consequently, it is not surprising that the exposure of OT systems in the electric power sector to cyberthreats is consistently high. As previously mentioned, adequate cybersecurity measures are often introduced with a significant delay when new facilities are commissioned.
The electric power sector has consistently had the highest percentage of ICS computers on which malicious objects were blocked throughout the reporting period. This value exceeds not only the regional average but also the global average by a wide margin.

Latin America
Current threats

- Latin America ranks second among all regions by the percentage of ICS computers on which malicious documents were blocked, with a percentage figure that is 1.8 times higher than the global average.
Threat actors distribute malicious documents via phishing emails and use them in attacks aimed at the initial infection of computers. Typically, malicious documents contain exploits, malicious macros, and malicious links.
- Email clients are the main source of this threat. The percentage of ICS computers on which threats from email clients were blocked in the region is 1.6 times higher than the global average. Latin America ranks third among regions based on this indicator.
Overall situation
Latin America ranks eighth globally by the percentage of ICS computers on which malicious objects were blocked.
In Q1 2025, the percentage decreased to 21%, falling below the global average.
Overall, the region exhibits a downward trend.

Comparative analysis
Threat categories

Compared to global averages, Latin America shows higher percentages of ICS computers on which the following threat categories were blocked:
- Malicious documents — by a factor of 1.8;
- Malicious scripts and phishing pages — by a factor of 1.3;
- Web miners — by a factor of 1.3.
Among all regions, Latin America ranks second by the percentage of ICS computers on which malicious documents were blocked.
Threat sources
Latin America ranks third globally by the percentage of ICS computers on which threats from email clients were blocked, with the percentage figure being 1.6 times higher than the global average.

Combined with high percentage figures for malicious scripts and phishing pages (see above), this indicates that systems in the OT infrastructure in the region are highly exposed to targeted attacks.
Quarterly changes and trends
Threat categories

The largest quarterly increase was observed in the percentage of ICS computers on which web miners were blocked, which was 1.7 times higher than in the previous quarter.

A heat map illustrates changes in threat category rankings in Latin America since Q2 2022. Throughout this period, malicious scripts and phishing pages have remained the leading threat category in the region. In Q1 2025, spyware and web miners each rose by one position in the ranking.

Threat sources
In Q1 2025, among all threat sources, only email clients showed a slight increase in the percentage of ICS computers on which malicious objects were blocked. The regional percentage figure remains 1.6 times higher than the global average.

The level of threats from email clients follows a gradual downward trend, in line with the global pattern; however, the regional percentage figure remains significantly higher than the global average.

Industries
In the region, among the industries analyzed in this report, malicious objects are most frequently blocked in the OT infrastructure of biometrics.
The only industry where the percentage of ICS computers on which malicious objects were blocked exceeds (by a factor of 1.1) the global average is oil and gas.

In Q1 2025, the percentage of ICS computers on which malicious objects were blocked increased slightly in the OT infrastructure of biometric, oil and gas, and manufacturing sectors.

Despite fluctuations, the industries analyzed have shown mainly positive dynamics in their long-term trends since Q3 2023.

Southern Europe
Current threats

Although Southern Europe ranks ninth among regions by the percentage of ICS computers on which malicious objects were blocked, in some respects the region’s threat landscape is not as favorable as it might seem.
- Southern Europe ranks first globally by the percentage of ICS computers on which threats from email clients were blocked. This metric is 2.4 times higher than the global average.
Email plays a significant role in threat propagation in the region.

- In Q1 2025, Southern Europe ranks first among regions by the percentage of ICS computers on which malicious scripts and phishing pages were blocked. In the region, this percentage is 1.4 times higher than the global average.

Threat actors use malicious scripts for a wide range of purposes — from collecting data, tracking, and redirecting a user’s browser to a malicious web resource, to delivering a variety of malware (including spyware, malware for covert cryptocurrency mining or ransomware) to the user’s system or browser. Malicious scripts are distributed both online and via email messages.
- Southern Europe also ranks first among all regions by the percentage of ICS computers on which malicious documents were blocked, with the percentage figure exceeding the global average by a factor of 2.2.
Threat actors deliver malicious documents via phishing emails and use them in attacks designed to ensure initial infection. Malicious documents typically contain exploits, malicious macros, and malicious links.

Taken together, these factors suggest that the risk of successful targeted attacks on systems in the OT infrastructure in the region is among the highest in the world.
- Southern Europe ranks second among all regions by the percentage of ICS computers on which spyware was blocked. The region’s percentage figure is 1.6 times higher than the global average. In Q1 2025, the region ranked first by growth of this indicator.
- Another high indicator in the region is the percentage of ICS computers on which ransomware is blocked, which is 1.5 times higher than the global average. This category of malware is often distributed using spyware. In Q1 2025, Southern Europe ranked second by growth of this indicator.
- In Q1 2025, Southern Europe ranked first among all regions by growth of the percentage of ICS computers on which worms and malware for AutoCAD were blocked, and third by growth of the virus detection indicator.
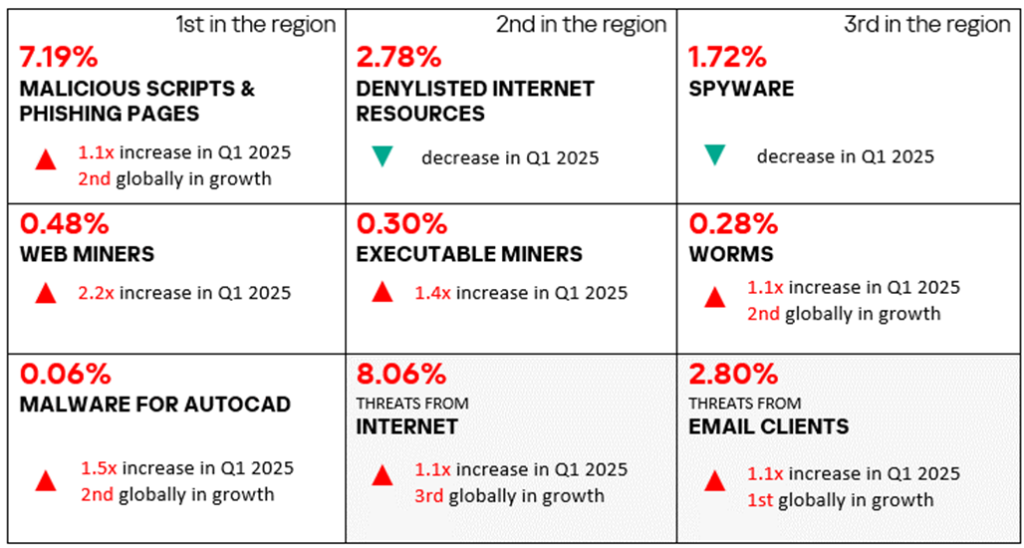
Overall
Southern Europe ranks ninth among all regions by the percentage of ICS computers on which malicious objects were blocked.
In Q1 2025, the region’s percentage figure was 20.8%, which is below the global average.

Comparative analysis
Threat categories

Compared to global averages, Southern Europe shows higher percentages of ICS computers on which the following threat categories were blocked:
- Malicious documents — by a factor of 2.2;
- Spyware — by a factor of 1.6;
- Ransomware — by a factor of 1.5;
- Malicious scripts and phishing pages — by a factor of 1.4.
In Q1 2025, Southern Europe ranks first among regions by the percentage of ICS computers on which the following threats were blocked:
- Malicious documents.

- Malicious scripts and phishing pages.

Southern Europe ranks second by the percentage of ICS computers on which spyware was blocked.

Threat sources
Southern Europe ranks first globally by the percentage of ICS computers on which threats from email clients were blocked. This percentage is 2.4 times higher than the global average.

Quarterly changes and trends
Threat categories

In Q1 2025, Southern Europe ranks first among all regions by growth in the percentage of ICS computers on which the following threat categories were blocked:
- Spyware;
- Worms;
- Malware for AutoCAD.
The region also ranks second by growth in the percentage of ICS computers on which the following malicious objects were blocked:
- Malicious documents;
- Ransomware.
The largest increases over the previous quarter in Southern Europe were observed in the percentages of ICS computers on which the following threat categories were blocked:
- Web miners — by a factor of 1.4.

- Ransomware — by a factor of 1.4.

- Malware for AutoCAD — by a factor of 1.3.

- Viruses — by a factor of 1.3.

Other indicators that increased were the percentages of ICS computers on which the following threats were blocked:
- Worms — by a factor of 1.2;
- Miners in the form of executable files for Windows — by a factor of 1.2;
- Malicious documents — by a factor of 1.1.
A heat map illustrates changes in threat category rankings in Southern Europe since Q2 2022. In Q1 2025, the following changes were observed: malicious documents moved up from fourth to third place, and web miners moved up from seventh to sixth place.

Threat sources
In Q1 2025, Southern Europe saw an increase only in the percentage of ICS computers on which threats from email clients were blocked. The region’s percentage significantly exceeds the global average.


Industries
Among all industries and OT infrastructures analyzed in the report, malicious objects are most often blocked in Southern Europe in biometrics.
The highest percentages of ICS computers on which malicious objects were blocked were recorded in biometrics and building automation — 1.2 times and 1.1 times higher than the global averages, respectively.

In Q1 2025, the percentage of ICS computers on which malicious objects were blocked increased in the following sectors and OT infrastructures:
- Biometrics — by a factor of 1.1;
- Construction — by a factor of 1.1;
- Manufacturing — by a factor of 1.1;
- Building automation.

All selected sectors exhibit fluctuating trends in the percentage of ICS computers on which malicious objects were blocked. For biometrics and building automation, the indicator remains significantly above the regional average.

Russia
Current threats

- The internet is the primary source of threats in Russia.
In Q1 2025, the level of internet threats in Russia increased by a factor of 1.2. Russia ranks first globally by growth in the percentage of ICS computers on which internet threats were blocked. - Based on the percentage of ICS computers on which denylisted internet resources were blocked, Russia ranks second among all regions (after Africa). Russia is the only region where this percentage increased compared to the previous quarter. The percentage in the region is 1.1 times higher than the global average.
The list of denylisted internet resources is used to prevent initial infection attempts. The list is used to block primarily the following threats on ICS computers:
- Known malicious URLs and IP addresses used by attackers to host payloads and configurations;
- Suspicious (untrusted) web resources offering entertainment or gaming content, often abused to deliver unwanted software, cryptocurrency miners, or malicious scripts;
- CDN nodes leveraged by threat actors to deliver malicious scripts via legitimate websites;
- File-sharing and data exchange services, including public repositories, that are often used to host next-stage payloads and configurations.
Cybercriminals mainly use denylisted internet resources to distribute malware, carry out phishing attacks, and as command-and-control (C2) infrastructure. A significant part of such resources is used to deliver malicious scripts and phishing pages (HTML).
High values of this indicator typically point to:
- Weak enforcement of cybersecurity policies (ICS computers do have internet access in one way or another);
- Insufficient cybersecurity culture (employees access unsafe internet resources).
- In Q1 2025, Russia also ranks second among all regions by the percentage of ICS computers on which miners in the form of executable files for Windows were blocked.
In Russia’s regional ranking of threat categories, miners in the form of executable files for Windows are in fourth place. This is the highest position occupied by this category in any region. In the global ranking, this category is in seventh place.
Overall
Russia ranks 10th globally by the percentage of ICS computers on which malicious objects were blocked.
Since the beginning of 2023, this indicator has remained below the global average.
In Q1 2025, the percentage of ICS computers in which malicious objects were blocked increased to 19.2%.

Comparative analysis
Threat categories

Compared to global averages, Russia has higher percentages of ICS computers on which the following threats were blocked:
- Denylisted internet resources — by a factor of 1.1;
- Miners in the form of executable files for Windows.
Based on each of these indicators, Russia ranks second among all regions.
Threat sources
The percentage figures for all threat sources in Russia are below the corresponding global averages. The percentage figure for email clients in Russia is the lowest among all regions.

Quarterly changes and trends
Threat categories

The most significant increases in Russia compared to the previous quarter were recorded for the percentages of ICS computers on which the following categories of malicious objects blocked:
- Ransomware — by a factor of 2.2.

- Malicious documents — by a factor of 1.4.

- Malicious scripts and phishing pages – by a factor of 1.1.

- Denylisted internet resources — by a factor of 1.1. Russia is the only region where this indicator has increased.

A heat map illustrates changes in threat category rankings in Russia since Q2 2022. Since Q3 2023, denylisted internet resources have been the leading threat category in the region. In Q1 2025, the following changes in ranking were observed: miners in the form of executable files for Windows moved up from fifth to fourth place, and viruses rose from eighth to seventh place.

Threat sources
In Q1 2025, the level of internet and email threats in Russia increased by a factor of 1.2 each.

By growth in the percentage of ICS computers on which internet threats were blocked, Russia ranks first globally.

Despite the increase in the percentage of ICS computers on which email threats were blocked, Russia still ranks last among all regions based on this indicator.

Industries
Among all industries and OT infrastructures in Russia analyzed in this report, malicious objects are most often blocked in biometric systems.
In all sectors in Russia, the percentages of ICS computers on which malicious objects were blocked remain below the respective global averages.

In Q1 2025, the percentage of ICS computers on which malicious objects were blocked increased across all analyzed sectors in the region, with the exception of construction.

Despite the increases in Q1 2025 in the indicators of all industries in Russia (excluding construction), the long-term trends since Q4 2022 for the selected industries in Russia generally have exhibited positive dynamics (with figures gradually declining over time).

Australia and New Zealand
Current threats
This is one of the most cyber-secure regions in the world.
Overall
Australia and New Zealand rank 11th globally by the percentage of ICS computers on which malicious objects were blocked.
The percentage figure in the region is significantly below the global average, at 13.9%.

Comparative analysis
Threat categories

The percentage of ICS computers on which malicious objects were blocked is below the global average across all threat categories, with the exception of malicious scripts and phishing pages, where the regional figure closely matches the global average.
Threat sources
The percentage of ICS computers on which malicious objects were blocked is below the global average across all threat sources.

Quarterly changes and trends
Threat categories

The largest increases from the previous quarter in Australia and New Zealand were recorded for percentages of ICS computers on which the following categories of threats were blocked:
- Malicious scripts and phishing pages — by a factor of 1.1, second place among regions by growth in this category.

- Malware for AutoCAD — by a factor of 1.5, second place among regions for growth in this category.

- Web miners — by a factor of 2.2.

- Miners in the form of executable files for Windows — by a factor of 1.4.

The region also saw increases in the percentages of ICS computers on which the following malicious objects were blocked:
- Worms — by a factor of 1.1. Australia and New Zealand rank last among regions by the percentage of ICS computers on which worms are blocked, but third by growth in this indicator;
- Ransomware — by a factor of 1.1.
A heat map illustrates changes in threat category rankings in Australia and New Zealand since Q2 2022. In Q1 2025, web miners moved up from sixth position to fifth.

Threat sources
In Q1 2025, the percentage of ICS computers on which malicious objects were blocked increased across all threat sources in Australia and New Zealand, with the exception of removable media. The percentage of ICS computers affected by internet and email threats has increased by a factor of 1.1 for each of the sources.
In the ranking of regions by percentage of ICS computers on which threats from email clients were blocked, the region ranks seventh. However, Australia and New Zealand rank first among all regions by growth in the percentage of ICS computers affected by email threats, and third by growth in internet threats.

Industries
Among the industries analyzed in this report, building automation is the sector most frequently affected by threats in the region.

In Q1 2025, the percentage of ICS computers on which malicious objects were blocked increased across all selected industries, with the exception of engineering and ICS integrators. In the construction sector, the figure increased by a factor of 1.2.

Up until Q3 2023, building automation, the electric power sector, and engineering and ICS integrators exhibited trends in the percentage of ICS computers on which malicious objects were blocked with the highest amplitude of fluctuations around the regional average values. This trend continues in the electric power sector, while the other industries have shown greater stability. The construction industry still demonstrates a predominantly downward trend, staying below the regional average, although its indicator increased in the reporting period.

Western Europe
Current threats

This is one of the most cyber-secure regions globally.
Overall
Western Europe ranks 12th globally by the percentage of ICS computers on which malicious objects were blocked.
This percentage is among the lowest in the world and is significantly below the global average. In Q1 2025, it increased by 0.2 percentage points.

Comparative analysis
Threat categories

Compared to global averages, Western Europe has significantly lower percentages of ICS computers on which various threats were blocked across all threat categories.
Threat sources
The percentage figures for all threat sources in Western Europe are significantly lower than the corresponding global averages.

Quarterly changes and trends
Threat categories

The largest increases compared to the previous quarter were observed for percentages of ICS computers on which the following categories of malicious objects were blocked:
- Web miners — by a factor of 2.4.

- Viruses — by a factor of 1.2.
- Spyware, malicious documents, worms, and miners in the form of executable files for Windows — an increase of 1.1 times in each category.
By growth in the percentage associated with spyware, Western Europe ranks second among all regions.
A heat map illustrates changes in threat category rankings in Western Europe since Q2 2022. In Q1 2025, viruses moved up from eighth to seventh place in the regional ranking.

Threat sources
In Q1 2025, the percentage of ICS computers in Western Europe on which malicious objects from the internet were blocked increased.

At the same time, the percentage associated with internet threats in the region remains significantly below the global average.

Industries
Among the industries analyzed in this report, building automation is the sector most frequently affected by threats in the region.
Across all sectors in Western Europe, the percentage of ICS computers on which malicious objects were blocked remains significantly lower than the corresponding global averages.

In Q1 2025, the percentage of ICS computers on which malicious objects were blocked increased in two sectors: building automation and engineering and ICS integrators.

Building automation and biometrics continue to show trends that are noticeably above the regional average.

Northern Europe
Current threats

This is the most cybersecure region of the world, which traditionally ranks last by the percentage of ICS computers on which malicious objects are blocked.
However, in Q1 2025, the region ranked fifth globally by growth in the percentage associated with ransomware, with an increase of 1.6 times.
Overall situation
Northern Europe ranks 13th among all regions by the percentage of ICS computers on which malicious objects were blocked.
This percentage is significantly lower than the global average.
In Q1 2025, in Northern Europe, the percentage of ICS computers on which malicious objects were blocked increased to 10.7%, which is the lowest value among all regions.

Comparative analysis
Threat categories

For each threat category, the percentage of ICS computers on which malicious objects were blocked is noticeably lower than the corresponding global average.
Threat sources
In the region, the percentage values associated with all threat sources are significantly below global averages.

Quarterly changes and trends
Threat categories
Most threat categories in the region show a decline in the percentage of ICS computers affected.

The largest increases relative to the previous quarter were in the percentages of ICS computers on which the following malicious objects were blocked:
- Ransomware — by a factor of 1.6.

- Malicious documents — by a factor of 1.1.

A heat map illustrates changes in the rankings of threat categories in Northern Europe since Q2 2022. In Q1 2025, there were no changes in category rankings.

Threat sources
In Q1 2025, the percentage of ICS computers in Northern Europe on which internet threats were blocked increased.

At the same time, in the region, the percentage values associated with the internet remain significantly lower than the global average.

Industries
Among the industries analyzed in the report, building automation is the most frequently affected sector in Northern Europe.
Across all industries in the region, the percentage of ICS computers on which malicious objects were blocked remains significantly lower than the respective global averages.

In Q1 2025, the percentage of ICS computers on which malicious objects were blocked increased only in the building automation sector, by a factor of 1.1.

The trend for building automation remains noticeably above the regional average.

Methodology used to prepare statistics
This report presents the results of analyzing statistics obtained with the help of Kaspersky Security Network (KSN). The data was received from KSN users who consented to its anonymous sharing and processing for the purposes described in the KSN Agreement for the Kaspersky product installed on their computer.
The benefits of joining KSN for our customers include faster response to previously unknown threats and a general improvement in the quality of detection by their Kaspersky installation achieved by connecting to a cloud-based repository of malware data that is not transferable to the customer in its entirety by nature of its size and the amount of resources that it uses.
Data shared by the user contains only the data types and categories described in the appropriate KSN Agreement. This data helps to a significant extent in analyzing the threat landscape and serves as a prerequisite for detecting new threats including targeted attacks and APTs1.
Statistical data presented in the report was obtained from ICS computers that were protected with Kaspersky products and which Kaspersky ICS CERT categorized as enterprise OT infrastructure. This group includes Windows computers that serve one or several of the following purposes:
- Supervisory control and data acquisition (SCADA) servers
- Building automation servers
- Data storage (Historian) servers
- Data gateways (OPC)
- Stationary workstations of engineers and operators
- Mobile workstations of engineers and operators
- Human machine interface (HMI)
- Computers used to manage technological and building automation networks
- Computers of ICS/PLC programmers
Computers that share statistics with us belong to organizations from various industries. The most common are the chemical industry, metallurgy, ICS design and integration, oil and gas, energy, transport and logistics, the food industry, light industry, pharmaceuticals. This also includes systems from engineering and integration firms that work with enterprises in a variety of industries, as well as building management systems, physical security, and biometric data processing.
We consider a computer as attacked if a Kaspersky security solution blocked one or more threats on that computer during the period in review: a month, six months, or a year depending on the context as can be seen in the charts above. To calculate the percentage of machines whose malware infection was prevented, we take the ratio of the number of computers attacked during the period in review to the total number of computers in the selection from which we received anonymized information during the same period.
- We recommend that organizations subject to restrictions on sharing any data outside the corporate perimeter consider using Kaspersky Private Security Network ↩︎