25 March 2021
Threat landscape for industrial automation systems. Statistics for H2 2020
This report presents the findings of an analysis of statistical data obtained using the distributed antivirus network known as Kaspersky Security Network (KSN). The data was received from those KSN users who gave their voluntary consent to have data anonymously transferred from their computers and processed for the purpose described in the KSN Agreement for the Kaspersky product installed on their computer.
Connecting to the KSN network enables our customers to reduce the time it takes the security solutions installed on their systems to respond to previously unknown threats and to improve the overall detection quality provided by the security products through querying the cloud infrastructure in which malicious object data is stored. That data is technically impossible to transfer entirely to the client side due to its large size and resource consumption.
The telemetry data transferred by the user includes only those types and categories of information that are described in the relevant KSN Agreement. This data is not only significantly helpful in analyzing the threat landscape but it is also necessary for identifying new threats, including targeted attacks and advanced persistent threats (APT)1.
Methodology used to prepare statistics
The statistical data presented in the report was received from ICS computers protected by Kaspersky products that Kaspersky ICS CERT categorizes as part of the industrial infrastructure at organizations. This group includes Windows computers that perform one or several of the following functions:
- Supervisory control and data acquisition (SCADA) servers
- Data storage servers (Historian)
- Data gateways (OPC)
- Stationary workstations of engineers and operators
- Mobile workstations of engineers and operators
- Human Machine Interface (HMI)
- Computers used for industrial network administration
- Computers used to develop software for industrial automation systems
For the purposes of this report, “attacked computers” are those on which Kaspersky security solutions blocked one or more threats during the reporting period. When determining the percentages of machines on which malware infections were prevented, we use the ratio of the number of computers attacked during the reporting period to the total number of computers in our sample from which we received depersonalized information during the reporting period.
2020 – figures
| Indicator | H1 2020 | H2 2020 | 2020 |
|---|---|---|---|
| Global percentage of attacked ICS computers | 32.60% | 33.42% | 38.55% |
| Percentage of attacked ICS computers by region | |||
| Northern Europe | 10.1% | 11.5% | 12.3% |
| Western Europe | 15.1% | 14.8% | 17.6% |
| Australia | 16.3% | 17.0% | 18.9% |
| United States and Canada | 17.2% | 16.5% | 19.6% |
| Eastern Europe | 26.4% | 28.0% | 30.5% |
| Southern Europe | 27.6% | 29.6% | 33.1% |
| Latin America | 33.6% | 34.3% | 38.8% |
| Russia | 32.2% | 34.6% | 39.5% |
| Middle East | 34.0% | 34.6% | 40.2% |
| East Asia | 42.9% | 41.8% | 46.3% |
| South Asia | 38.8% | 41.3% | 47.0% |
| Central Asia | 43.7% | 43.9% | 48.8% |
| Africa | 45.6% | 46.4% | 51.2% |
| Southeast Asia | 49.8% | 47.5% | 53.9% |
| Main threat sources globally | |||
| Internet | 16.7% | 16.7% | 20.5% |
| Removable media | 5.8% | 5.4% | 7.0% |
| Email clients | 3.4% | 4.1% | 4.4% |
2020 – traits
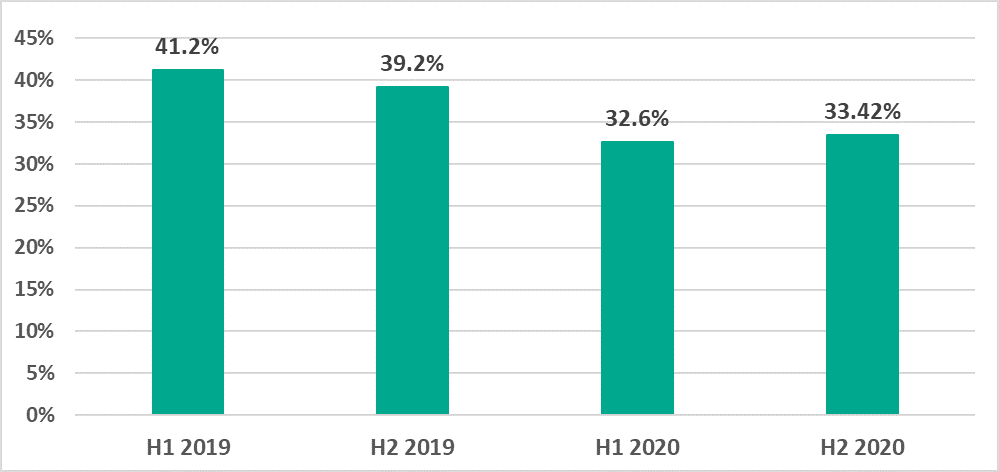
There is no longer a downward trend in the percentage of ICS computers on which malicious objects were blocked
Starting with the second half (H2) of 2019, we observed a decline in the percentages of ICS computers on which malicious objects were blocked. This was observed in industrial control systems (ICS) as well as in corporate and personal computing environments. This downward trend was not observed in the second half of 2020.
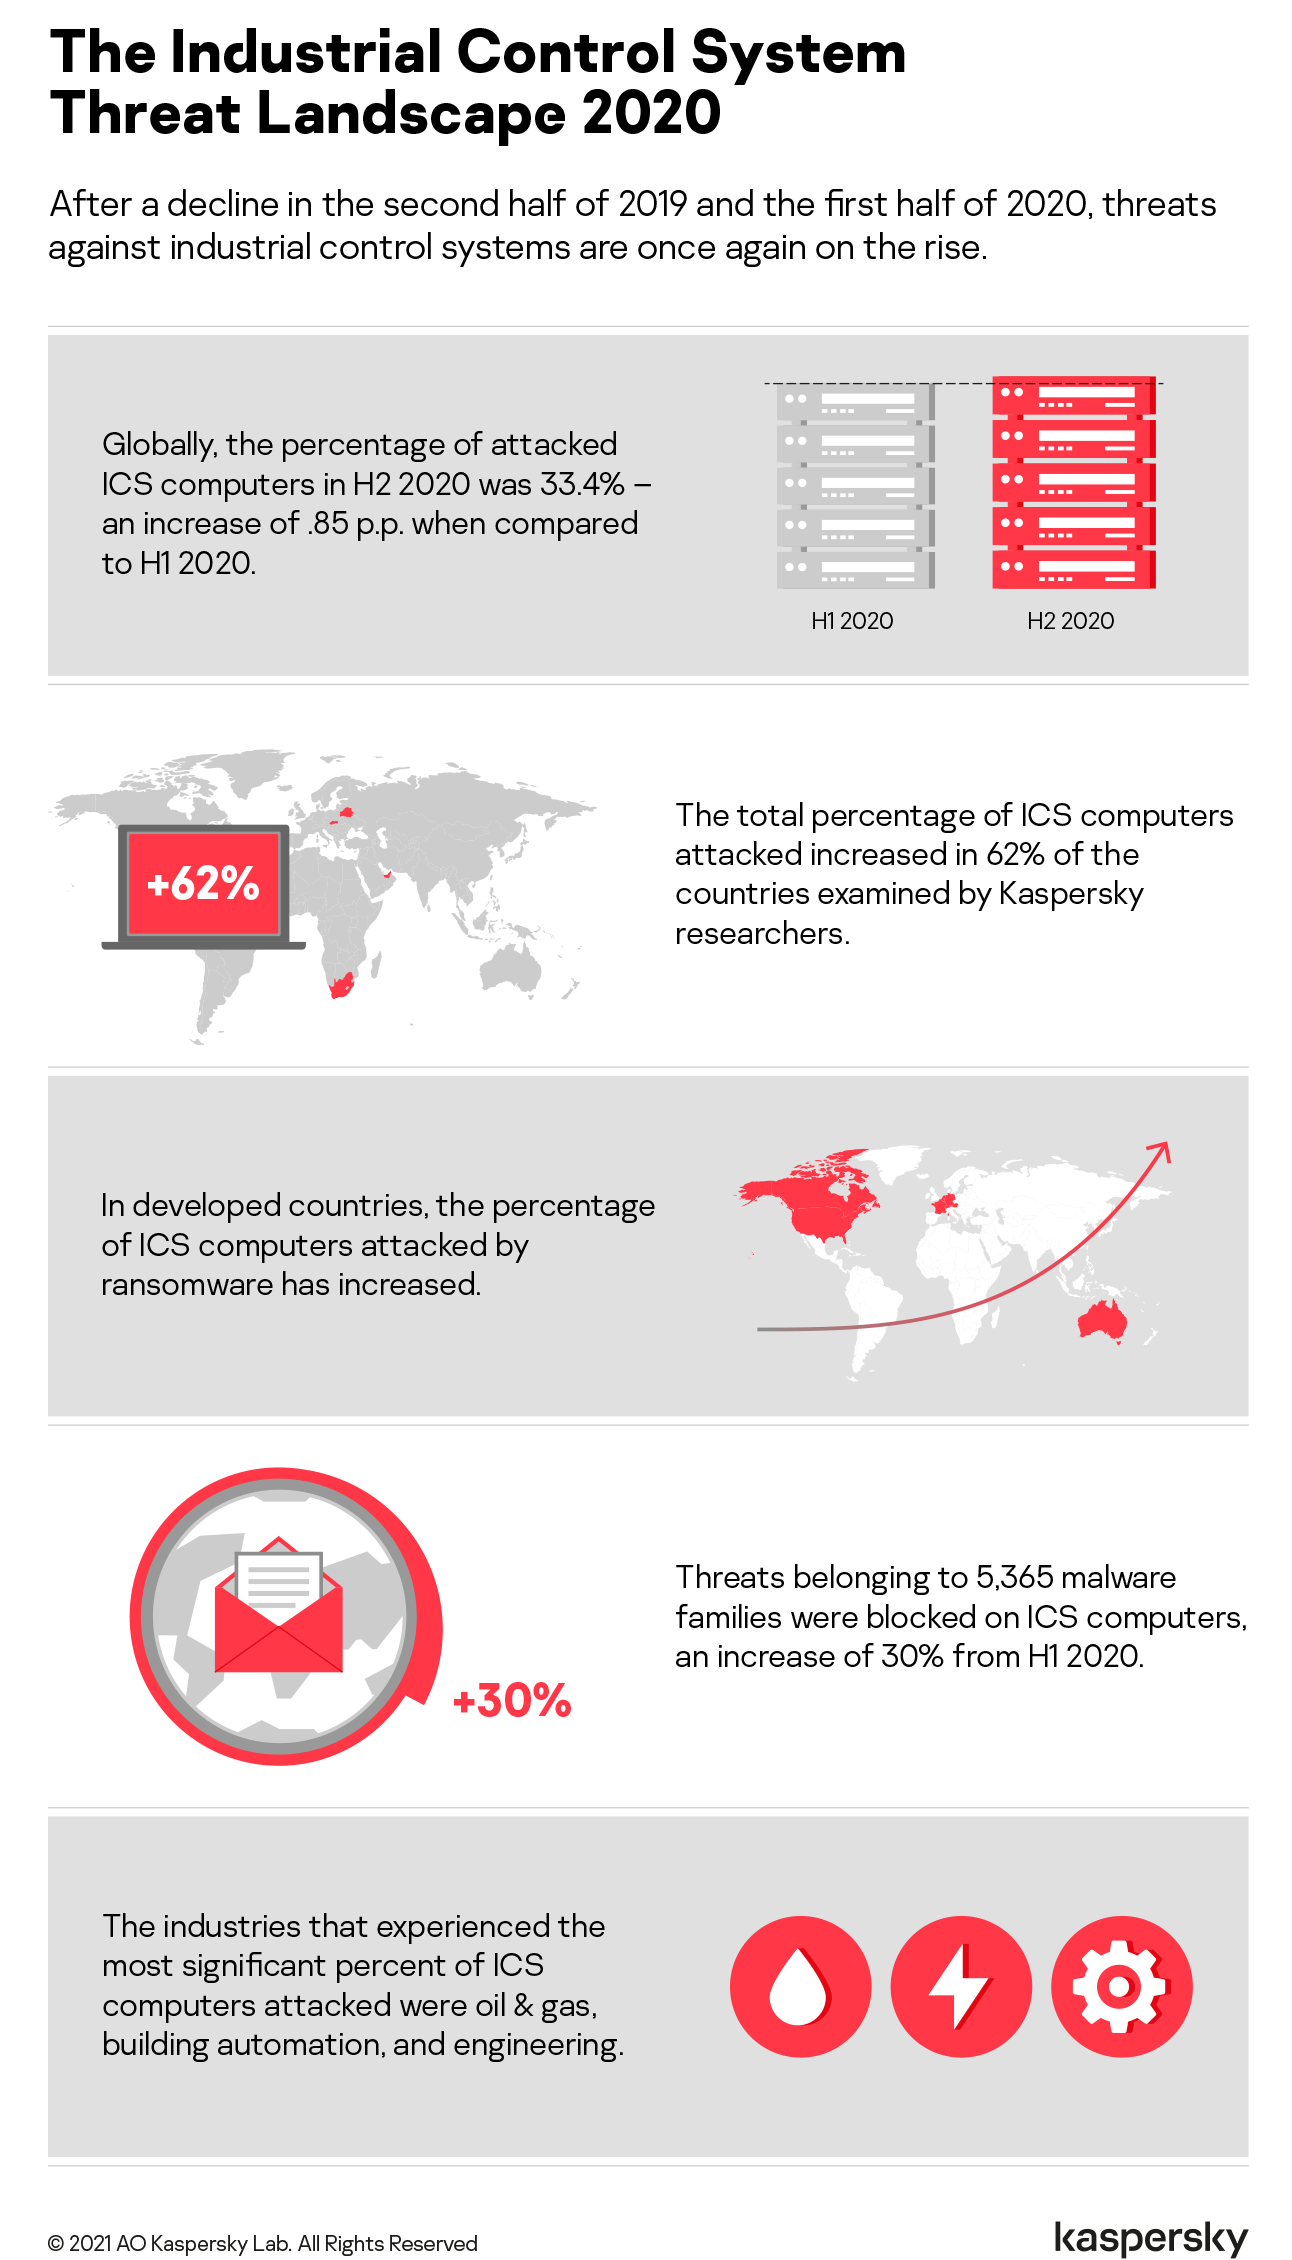
- Globally, the percentage of attacked ICS computers in the second half of the year was 33.4%, which was 0.85 percentage points (p.p.) higher than the first half (H1) of the year.
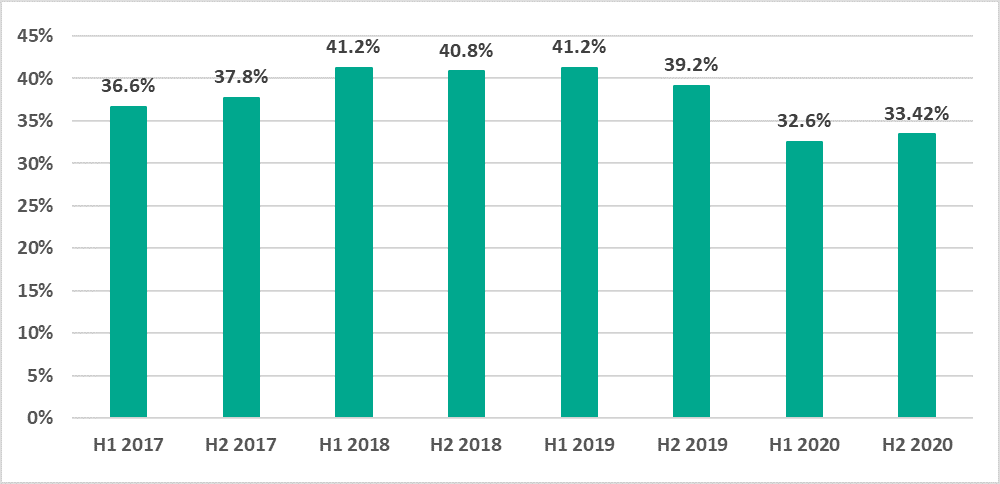
Figure 1. Percentage of ICS computers on which malicious objects were blocked, by half-year, 2017-2020 The percentage of attacked ICS computers increased in 62% of countries.
In H2 2020, the percentage of ICS computers on which malicious objects were blocked increased in relation to H1 in 62% of countries. In comparison, this trend was observed in 7% of countries in 2019, and the same was seen in H1 2020 compared to H2 2019.
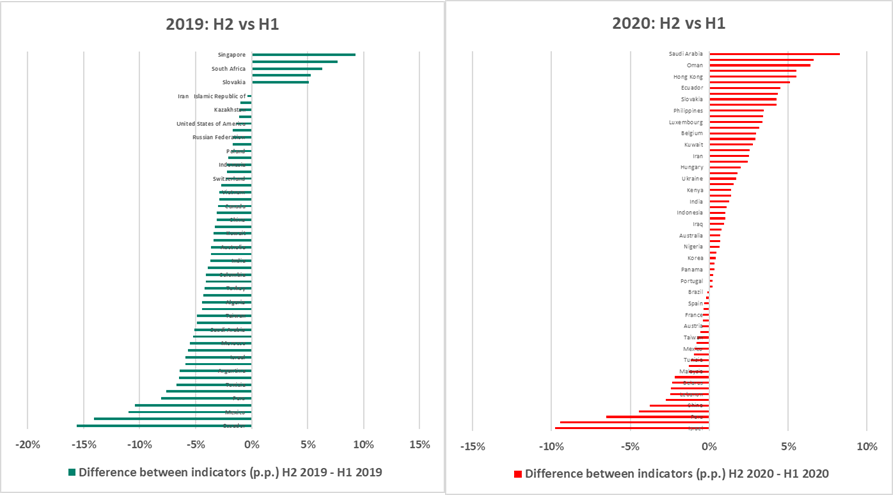
Figure 2. Change in the percentage of attacked computers in countries of the world (p.p.) in H2 compared to H1, 2019 vs 2020 The maximum growth of this indicator in a country was 8.2 p.p. (in Saudi Arabia), while most countries observed no more than a 4 p.p. increase. Therefore, the global average change over the half-year was insignificant.
- Globally, the percentage of attacked ICS computers in the second half of the year was 33.4%, which was 0.85 percentage points (p.p.) higher than the first half (H1) of the year.
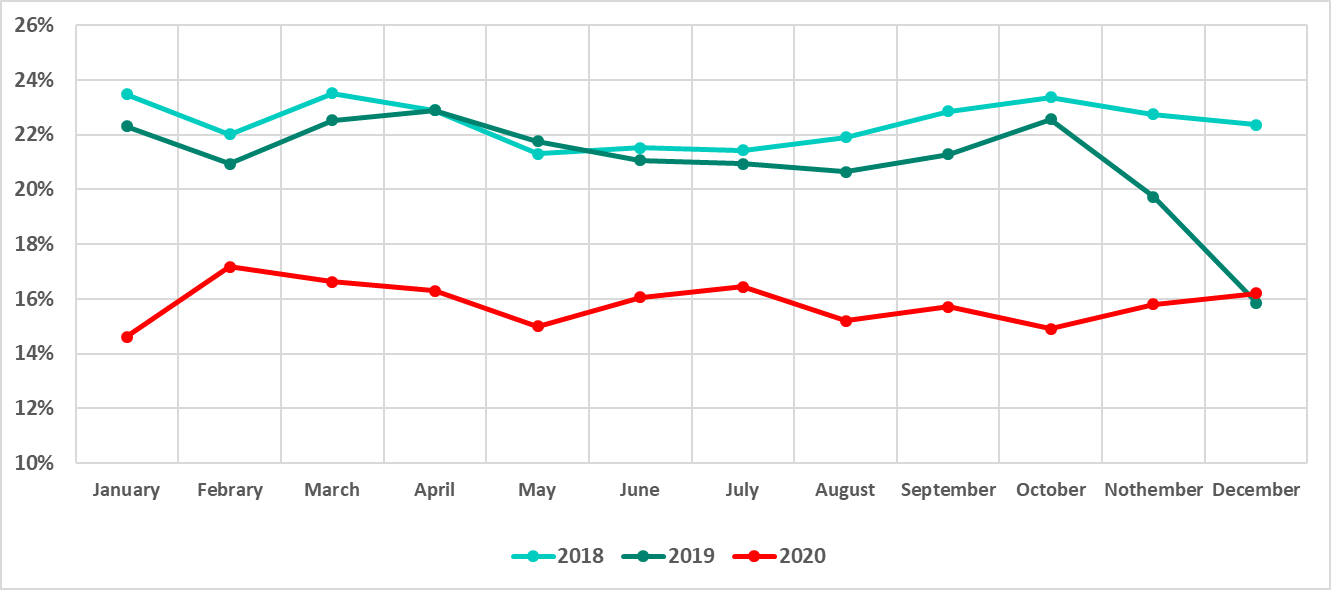
The seasonal fluctuations typical of past years were not observed this year
In previous years, the percentage of ICS computers on which malicious objects were blocked was at its maximum in March/April and October, while this indicator sagged between those months.
In 2020, this indicator behaved differently. It reached its maximum in February and dropped almost to its minimum in May. In the first two months of summer, it grew to its near-maximum in July. In October, the percentage of attacked ICS computers was one of the lowest.
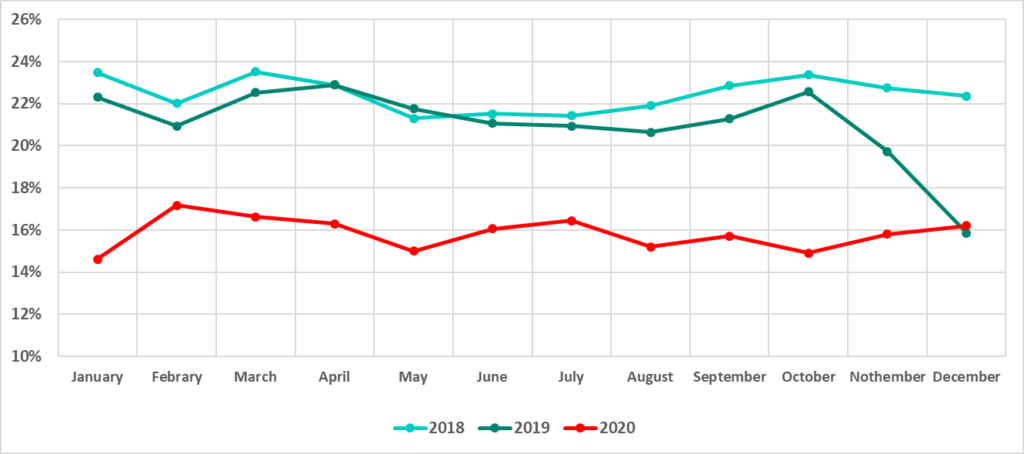
Figure 3. Percentage of ICS computers on which malicious objects were blocked, by month, 2018, 2019, 2020 The percentage of ICS computers on which malicious email attachments were blocked increased
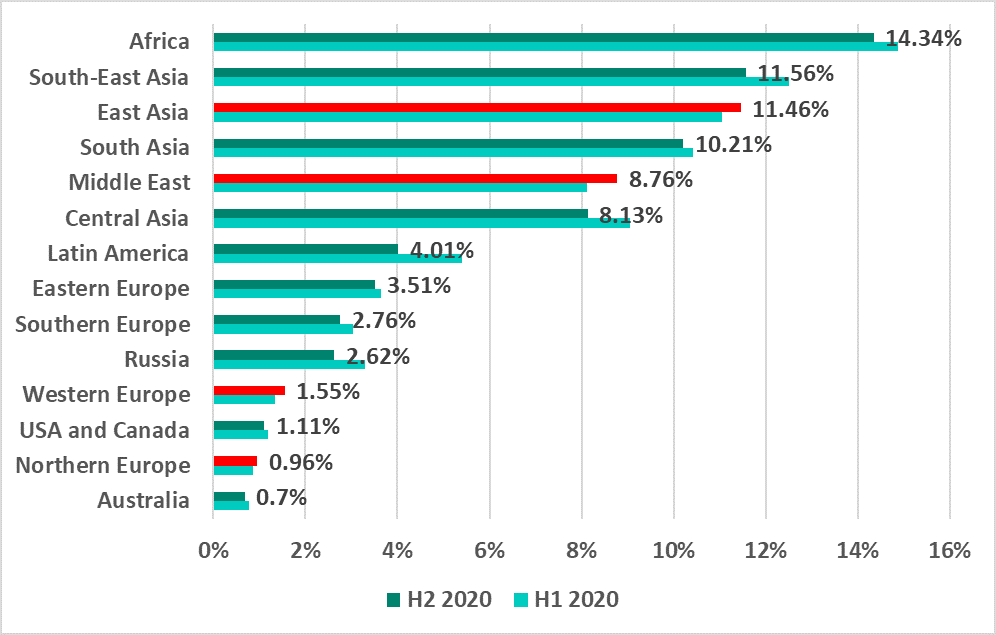
- Globally, in H2 2020, the percentage of ICS computers on which malicious email attachments were blocked increased by 0.7 p.p. compared to H1.
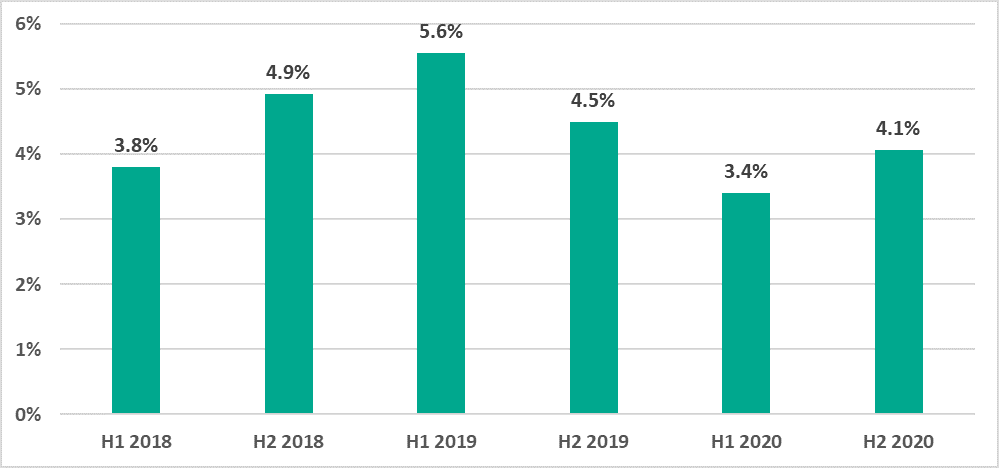
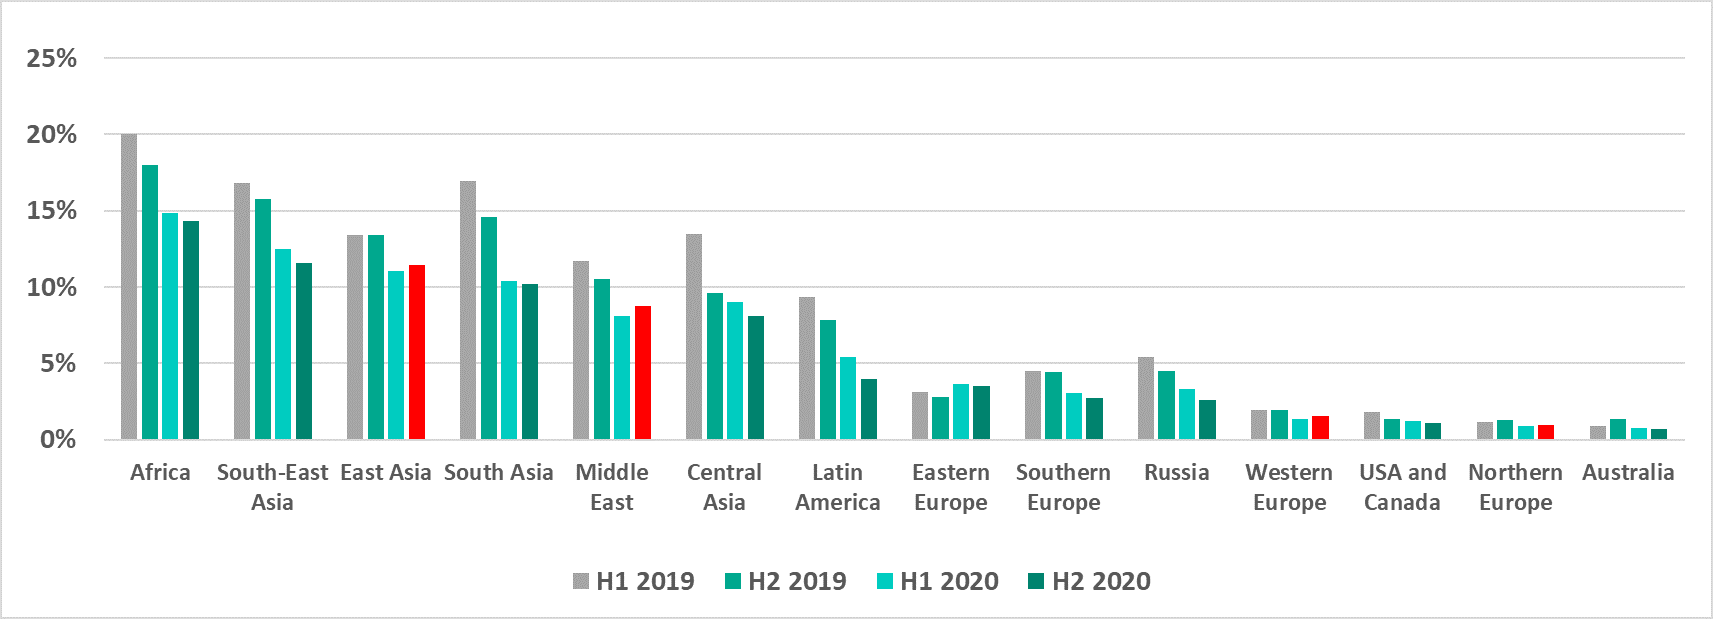
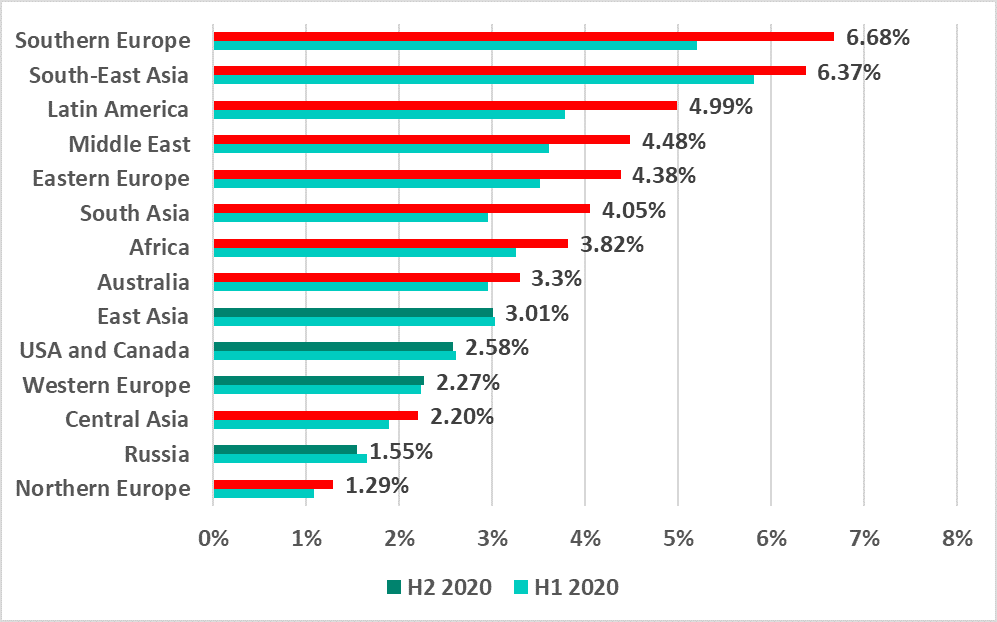
Figure 4. Percentage of ICS computers on which malicious email attachments were blocked - This indicator increased in all regions except East Asia, the US and Canada, Western Europe, and Russia.
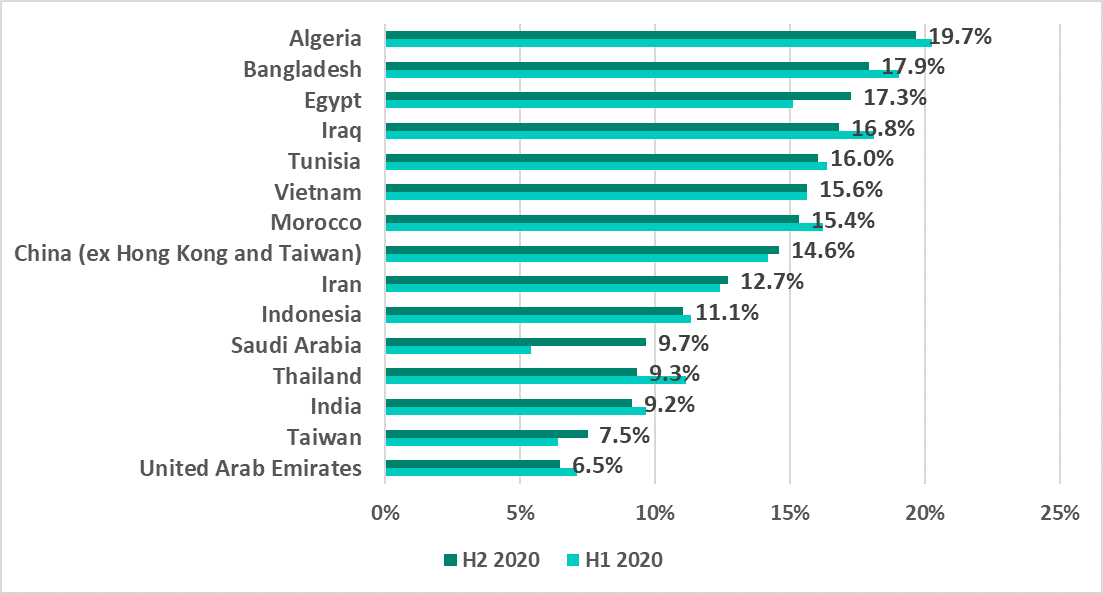
- In 73.4% of all countries in H2 2020, the percentage of ICS computers on which malicious email attachments were blocked increased compared to H1 2020. This is three times larger than the equivalent indicator for 2019 (23.6%).
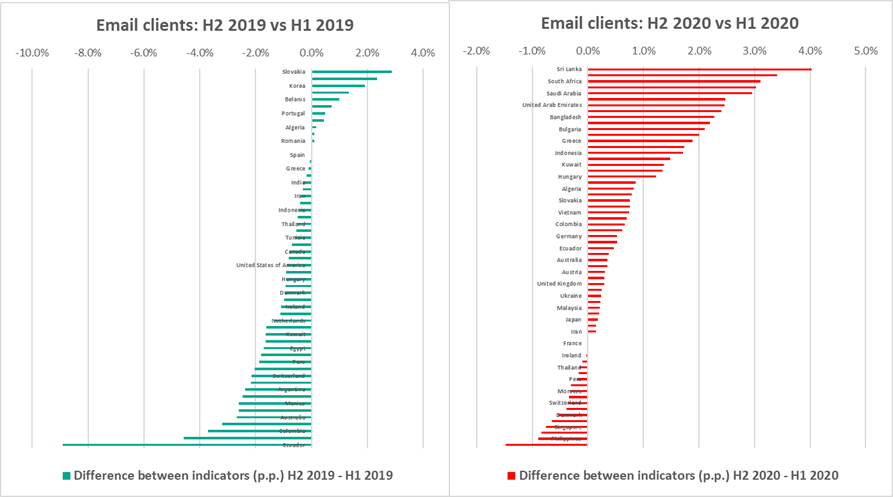
Figure 5. Change in the percentage of ICS computers (p.p.) on which malicious email attachments were blocked in H2 compared to H1, countries and territories, 2019 vs 2020 - Globally, in H2 2020, the percentage of ICS computers on which malicious email attachments were blocked increased by 0.7 p.p. compared to H1.
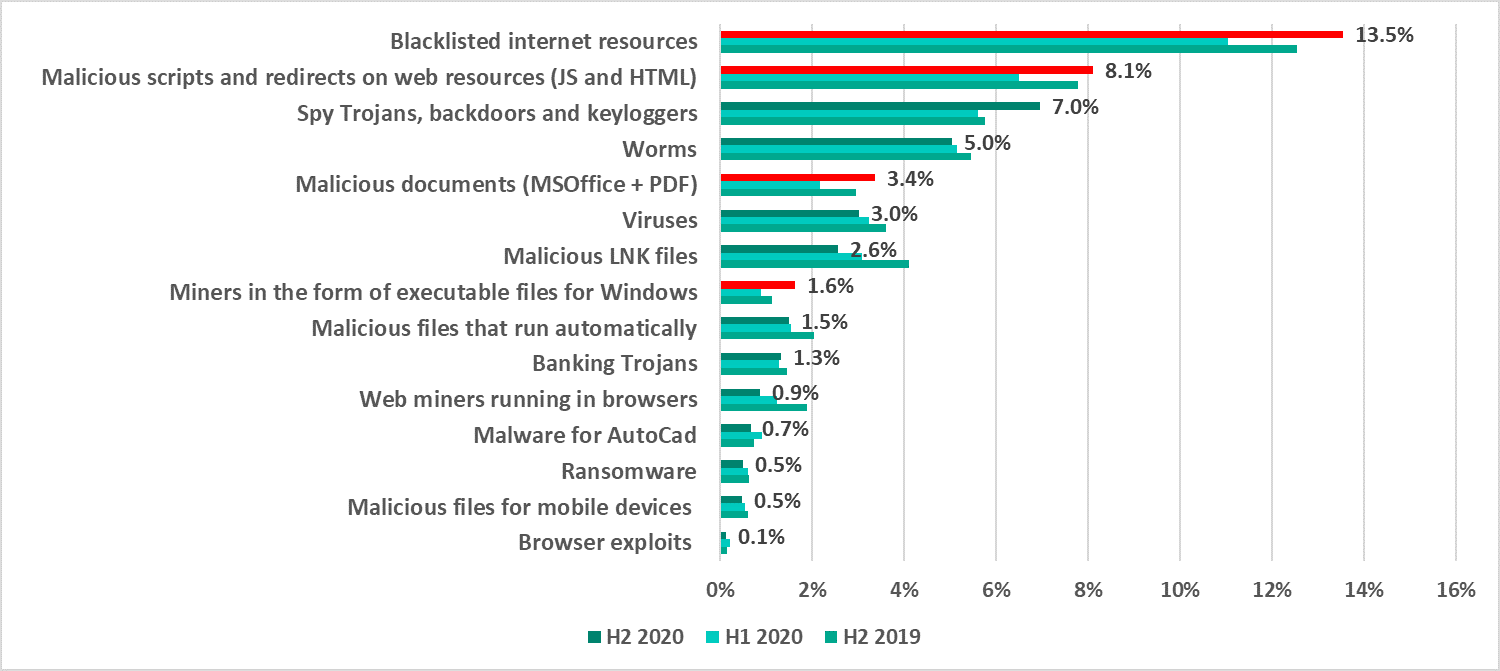
There was a rise in the percentage of ICS computers on which threats distributed over the internet and email, and spyware and miners were blocked
- Malicious objects from the internet – web resources involved in the distribution or management of malware (+2.5 p.p.), and malicious scripts and redirects on web resources (JS and HTML) (+1.6 p.p.).
- Typical threats distributed by email (+1.2 p.p.). – malicious MS Office and PDF documents (+1.2 p.p.).
- Spyware (+1.4 p.p.) – Trojans, backdoors, and keyloggers.
- Miners (+0.7 p.p.) – executable files for Windows.
For all these threats, the indicators of H2 2020 exceeded the equivalent results of not only H1 2020 but also H2 2019.
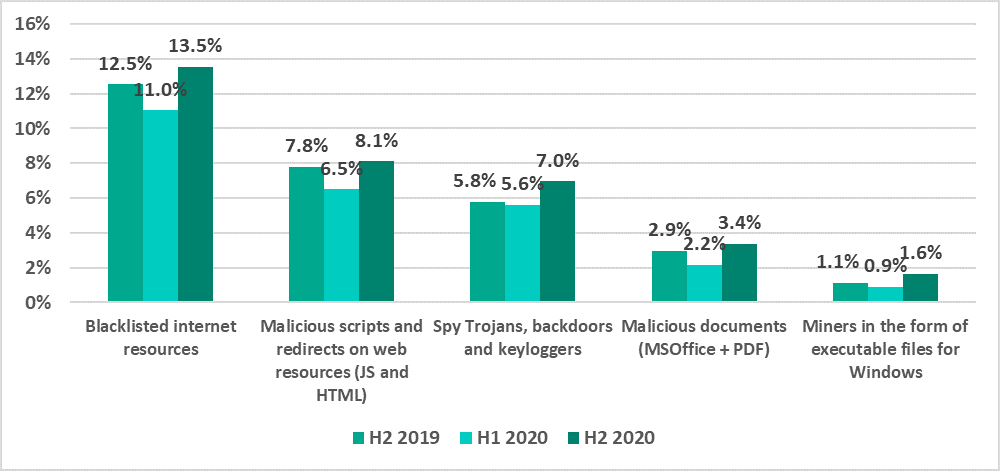
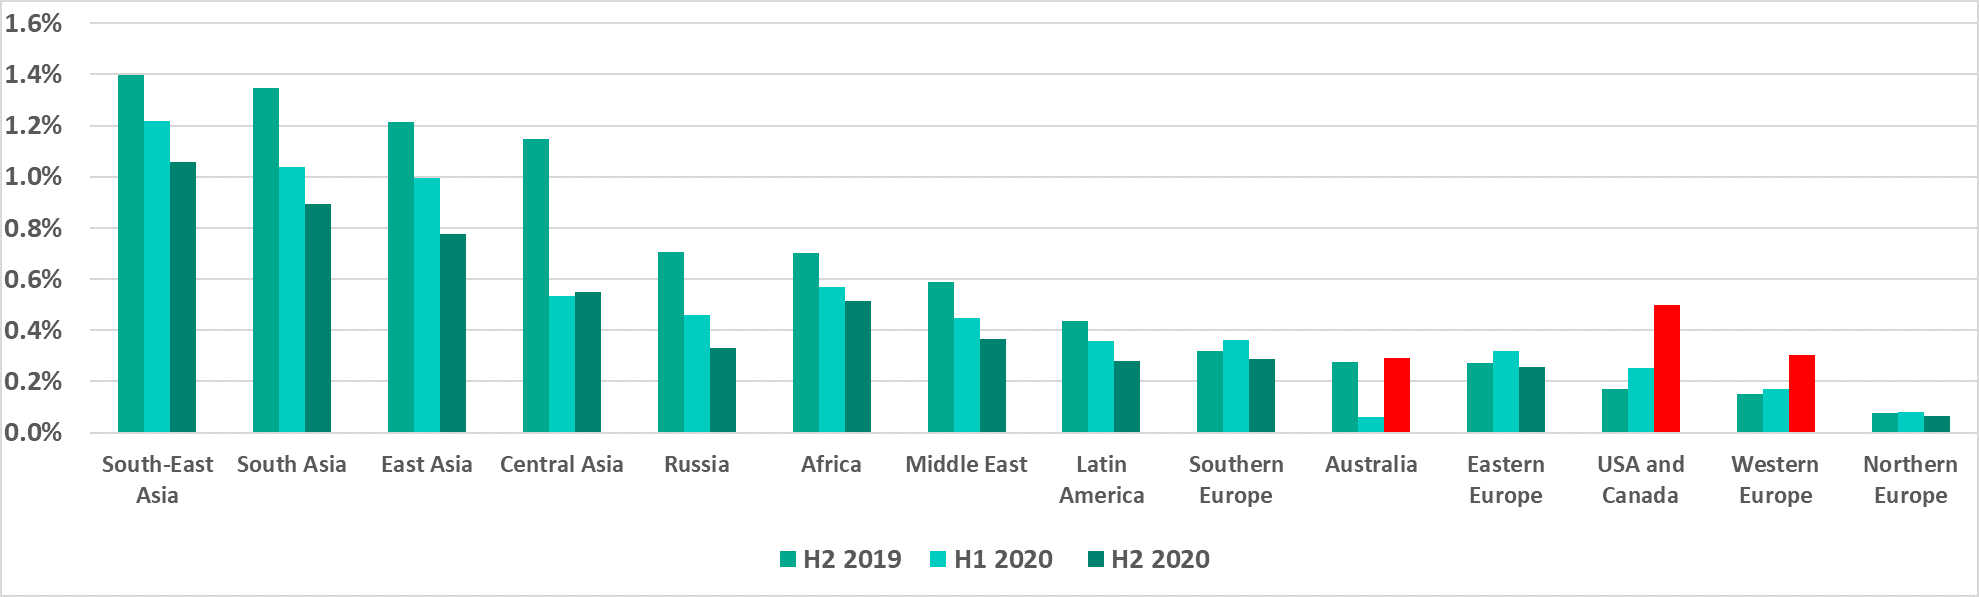
Figure 6. Percentage of ICS computers on which various types of malicious objects were blocked, H2 2019-H2 2020 In developed countries, the percentage of ICS computers attacked by ransomware increased
Globally, the percentage of ICS computers on which ransomware was blocked decreased from 0.63% in H1 to 0.49% in H2.
At the same time, this indicator increased in regions with developed countries:
- +0.25 p.p. in the US and Canada
- +0.23 p.p. in Australia
- +0.13 p.p. in Western Europe
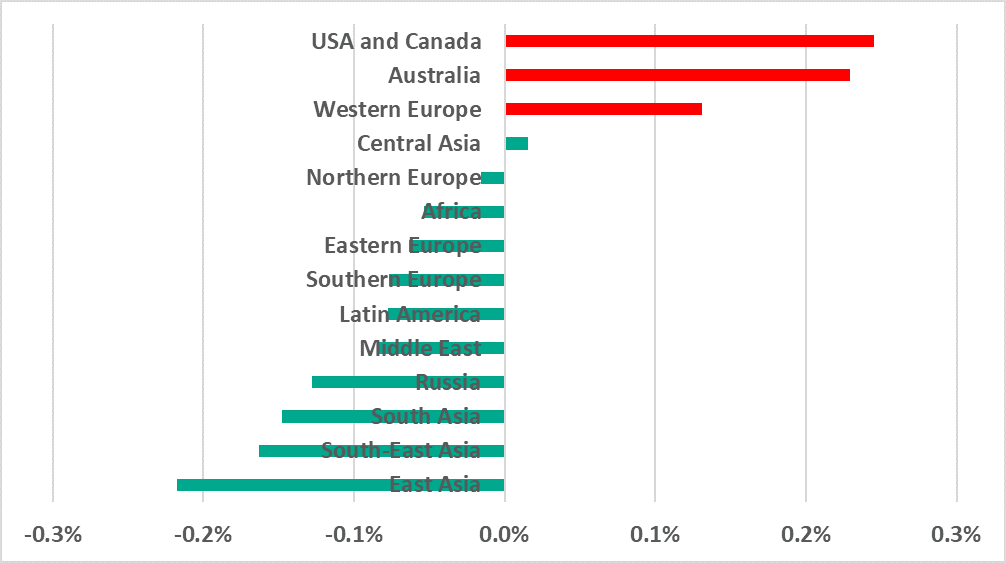
Figure 7. Change in the percentage of ICS computers (p.p.) on which ransomware was blocked in H2 2020 compared to H1
Impact of the COVID-19 pandemic
In our H1 2020 report, we wrote about the impact of the COVID-19 pandemic on the changes that we observed in the attack surface and threat landscape for industrial enterprises and industrial automation systems. In H2 2020, we continued our observations and identified a number of trends that could, in our opinion, be due to circumstances connected with the pandemic in one way or another, as well as the reaction of governments, organizations and people to these circumstances.
Changes in seasonal fluctuations in the percentage of attacked computers
It can be seen in the diagram in Figure 3 that in the past years the percentage of attacked ICS computers significantly decreased in summer months and in December. It is likely that this decrease was associated with traditional vacation periods: an infected USB drive cannot transfer malware from one computer to another all by itself, nor can an engineering workstation click on a link leading to a phishing website when the engineer is not there.
However, there was a noticeable change in the situation in 2020: we saw no significant seasonal fluctuations in the percentage of attacked computers. It is likely that this was due to changes in employee vacation schedules, since many people decided to go without vacations in the time of lockdown, travel restrictions, and closed borders.
Attacks on RDP remote connection services
Another effect of the pandemic was a noticeable increase in the percentage of ICS computers that could be accessed remotely via the RDP protocol.
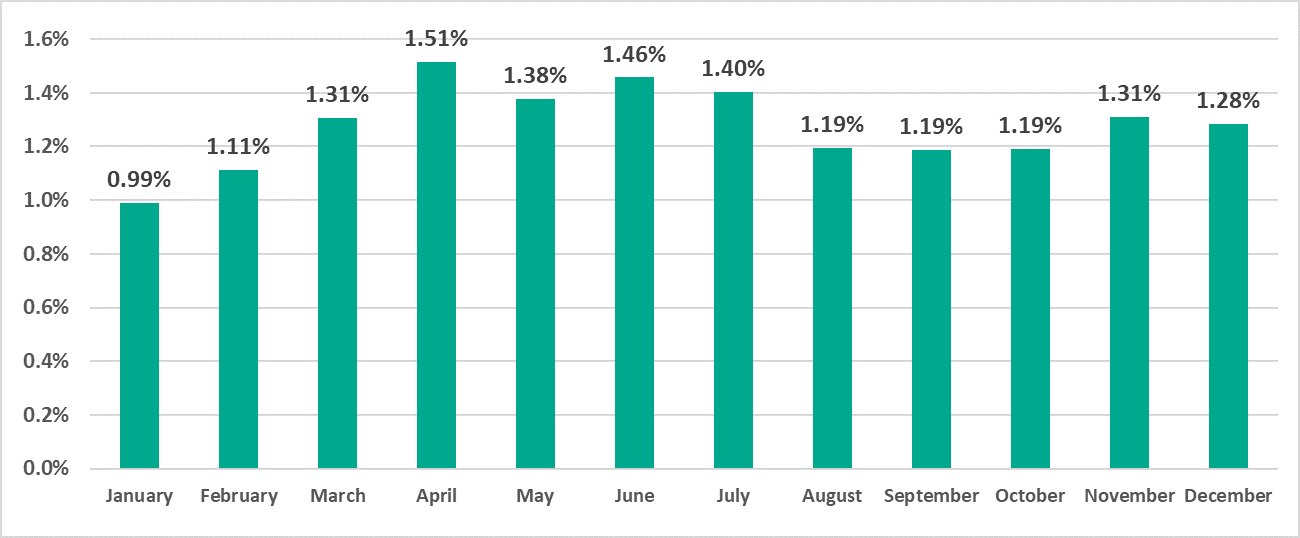
It can be seen in the diagram above that the percentage grew continuously from January to April – the time when many organizations were dealing with the challenges of organizing work under an impending and actual lockdown. Then, after some fluctuations, the percentage decreased somewhat and stabilized at a slightly higher level than before the pandemic.
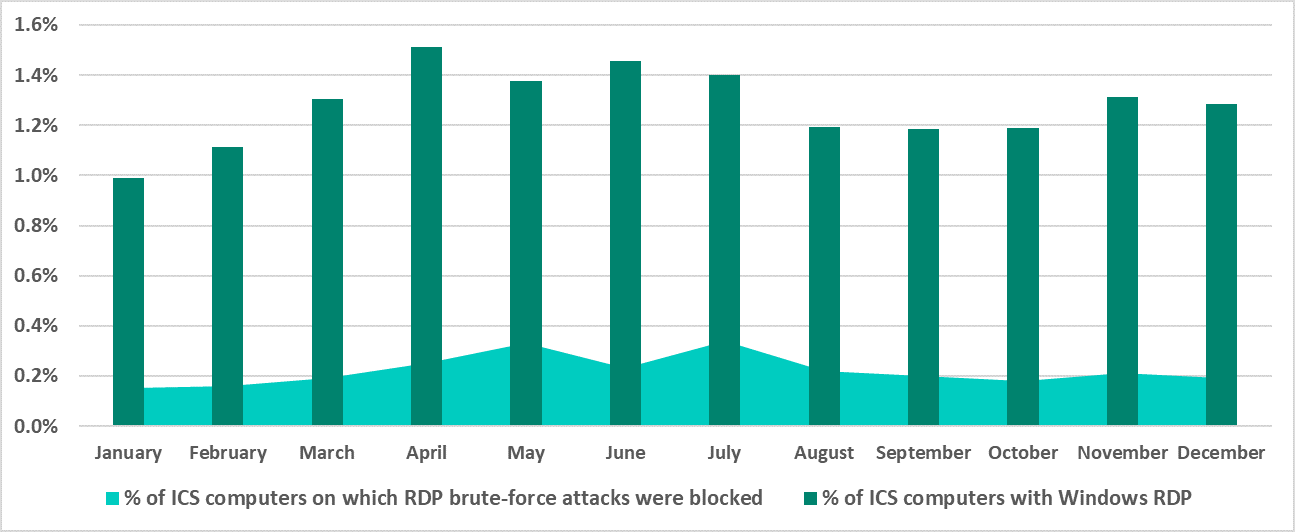
We do not have sufficient data to make conclusions as to what proportion of these computers could only be accessed from the industrial network of the enterprise, what part could be accessed from the corporate segment of the network and what percentage was available even outside the organization’s perimeter. However, we can state with confidence that the increase in the availability of ICS computers certainly affected the attack surface. Threat actors clearly took advantage of that – this is obvious from the following diagram, which shows the percentages of ICS computers on which brute force attacks on credentials used to access the RDP service were detected and blocked:
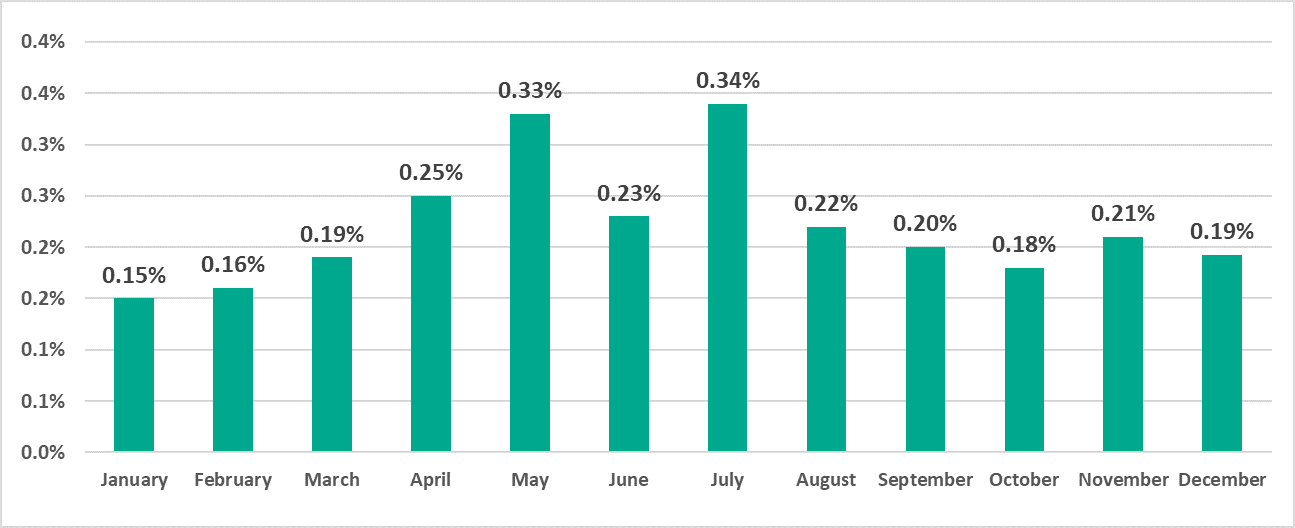
It is easy to notice a certain synchronism in the changes occurring in these two parameters: the percentage of attacked RDP connections follows the percentage of UCS computers available via RDP almost all through the year (from January to October) with a delay of approximately one month, catching up (i.e., the changes are synchronized) in October and November.
We can only guess whether the one-month ‘delay’ in changes occurring in the percentage of attacked computers had to do with the speed with which attacks propagated on the enterprise network or the speed with which threat actors responded to changes in the opportunity landscape (attack surface).
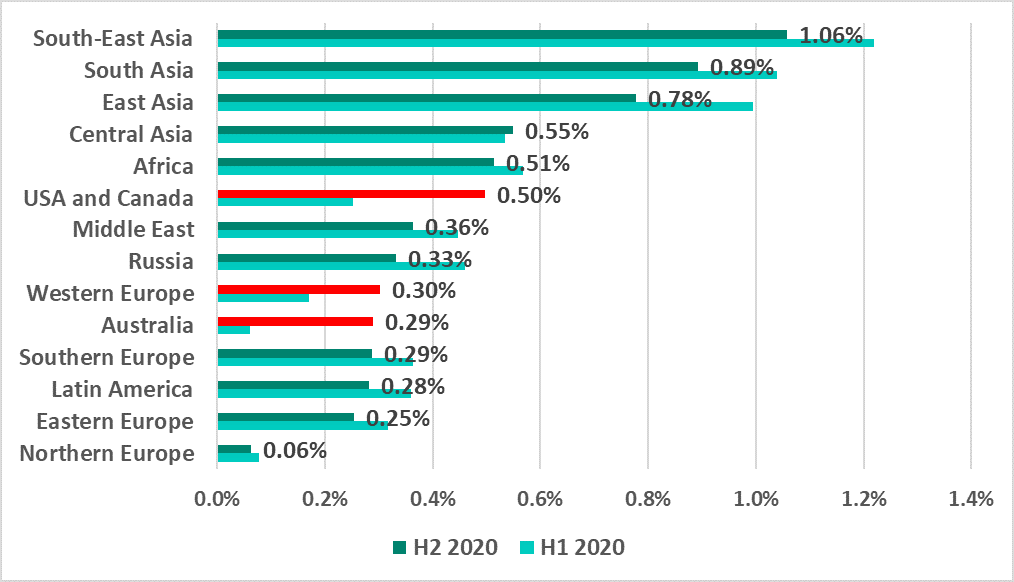
Changes in ransomware priorities
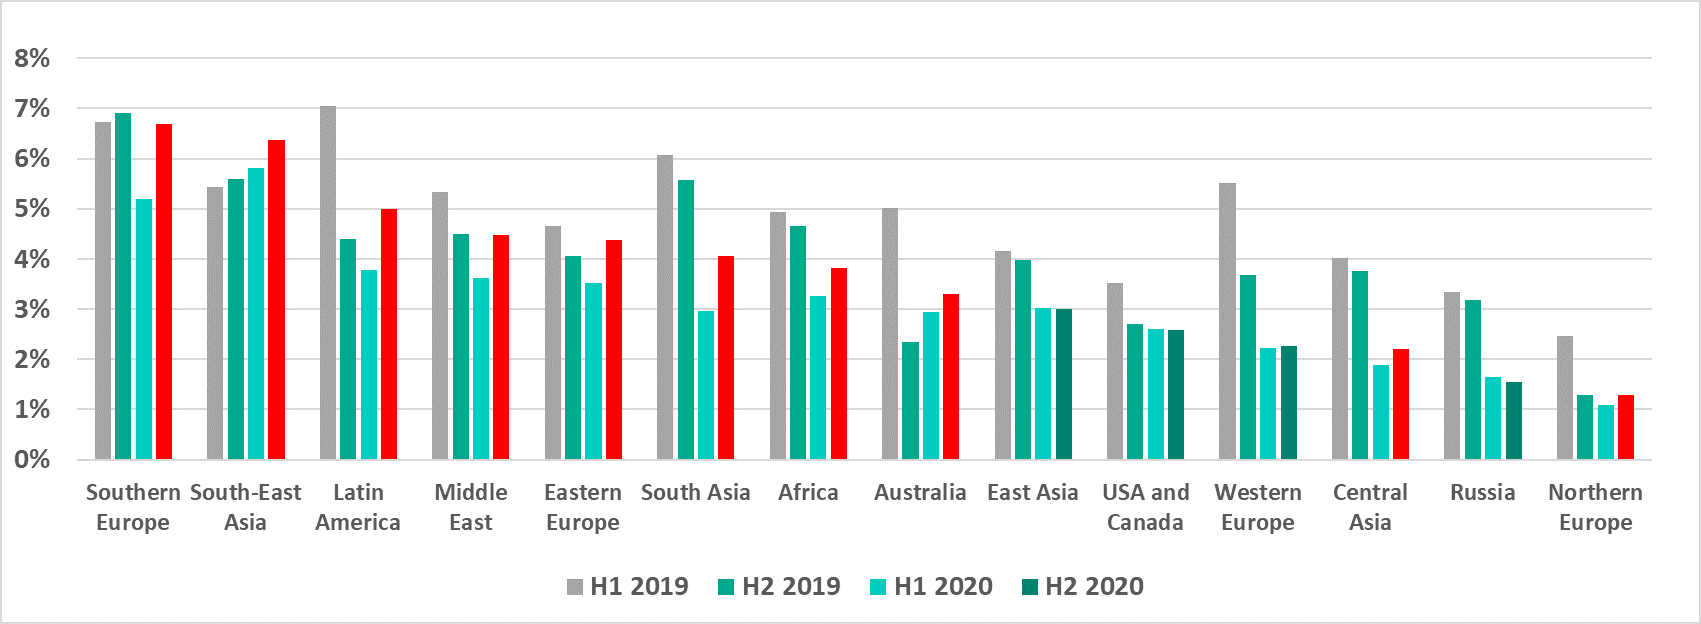
One more potential consequence of the pandemic can be identified by analyzing the dynamics of ransomware attacks on industrial enterprises in different regions, which can be indirectly assessed based on the percentage of ICS computers attacked by ransomware. It can be seen in the diagram in Figure 7, as well as the diagram below (Figure 11) that this percentage decreased in H2 2020 in all regions of the world except North America, Western Europe and Australia, where it did not just fail to decrease but increased several times over!
We believe that these curious dynamics could indicate the response of threat actors to the economic consequences of the pandemic. In those countries where the ‘creditworthiness’ of organizations decreased as a result of the pandemic, the number of attacks on industrial enterprises also fell (and so did the percentage of attacked ICS computers). At the same time, in countries where industrial organizations were generally more financially stable and were still able to pay ransom, the activity of attackers increased (and the percentage of attacked ICS computers surged). It can be hypothesized that the changes that we observed were due, among other things, to a shift in some groups’ focus when choosing victims towards organizations in more economically stable countries.
General statistics
Percentage of ICS computers on which malicious objects were blocked
In 2020 overall, the percentage of ICS computers on which malicious objects were blocked was 38.6%, which was 7.8 p.p. less than in 2019.
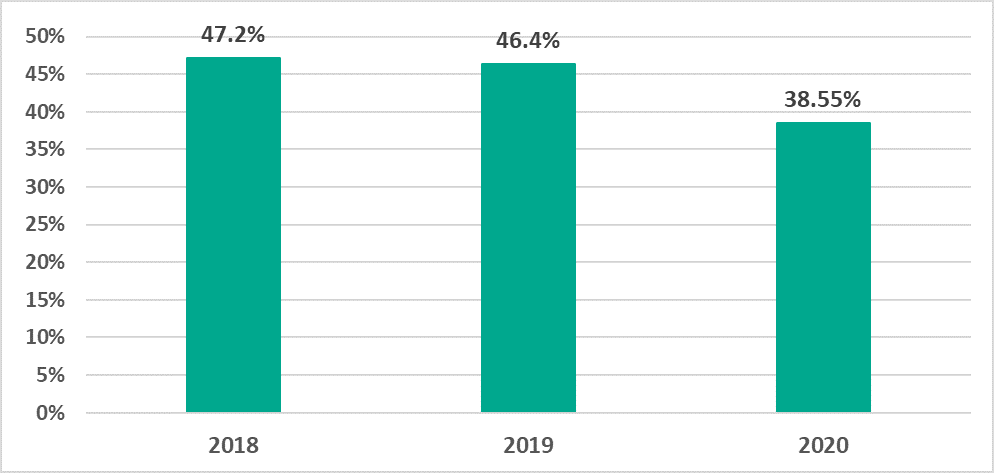
In H2 2020, the percentage of ICS computers on which malicious objects were blocked was 33.4%, 0.85 p.p. more than in H1 2020.
In 2020, the change in the percentage of attacked ICS computers by month was relatively smooth, with no clear downward trend of this indicator. The seasonal fluctuations observed in previous years were also not observed during the year.
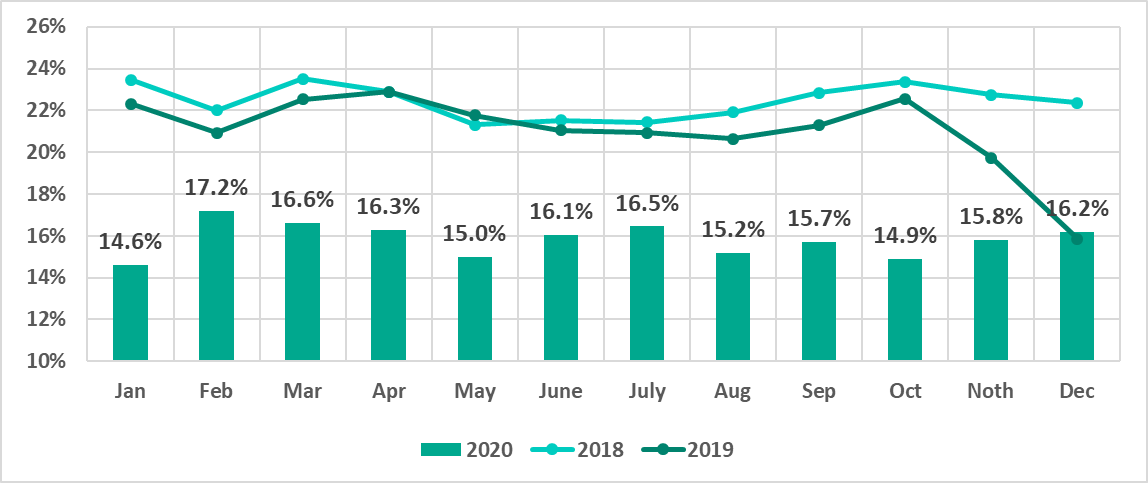
Minimum values were recorded in January (14.6%), October (14.9%), and May (15.0%). Maximum values were recorded in February (17.2%), March (16.6%), and July (16.5%).
Selected industries
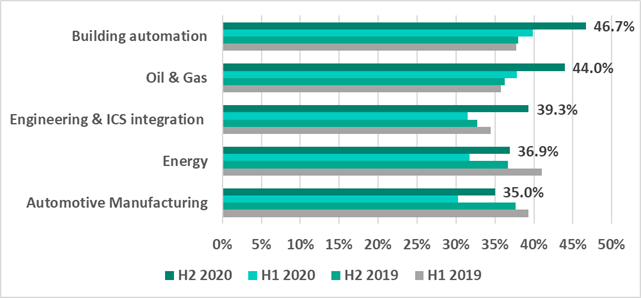
In H2 2020, the percentage of ICS computers on which malicious objects were blocked increased in all the represented industries.
An engineering case analysis was published in a separate report.
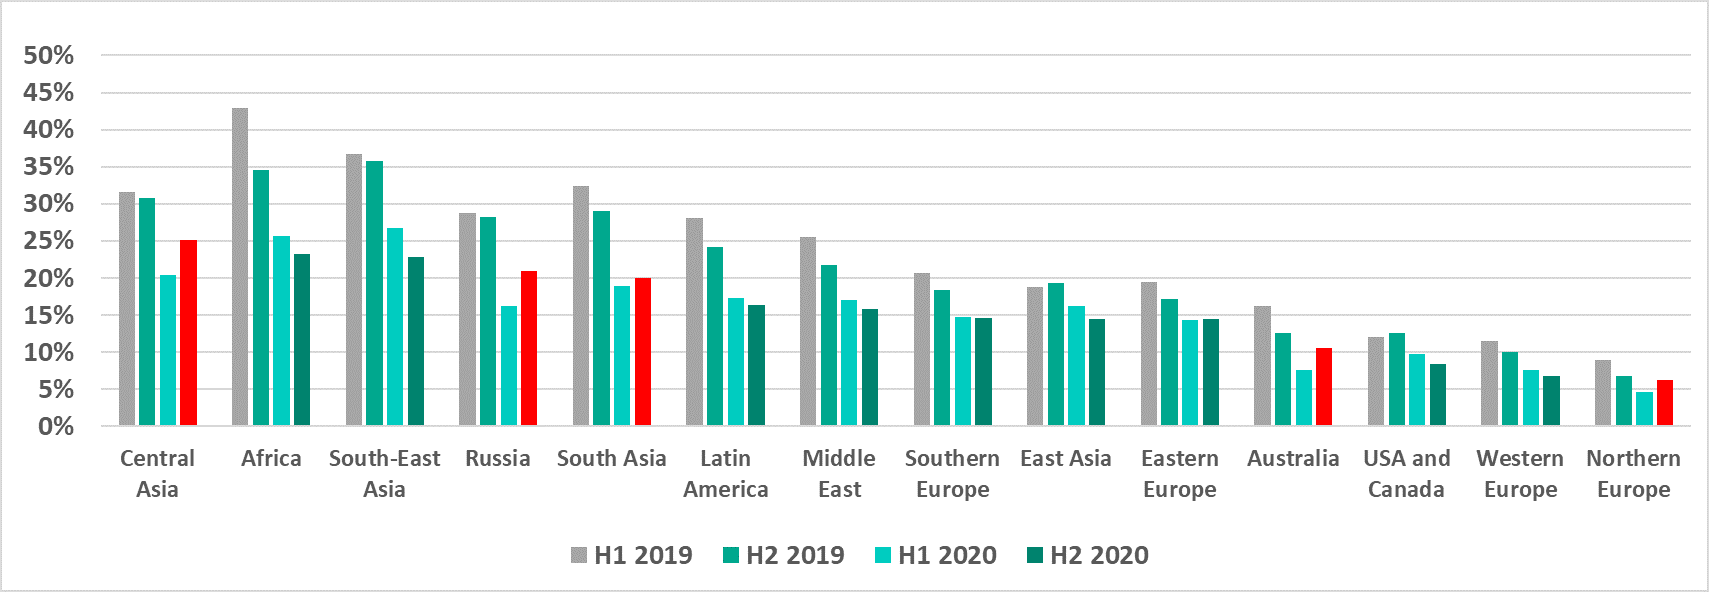
Geographical distribution
Regions
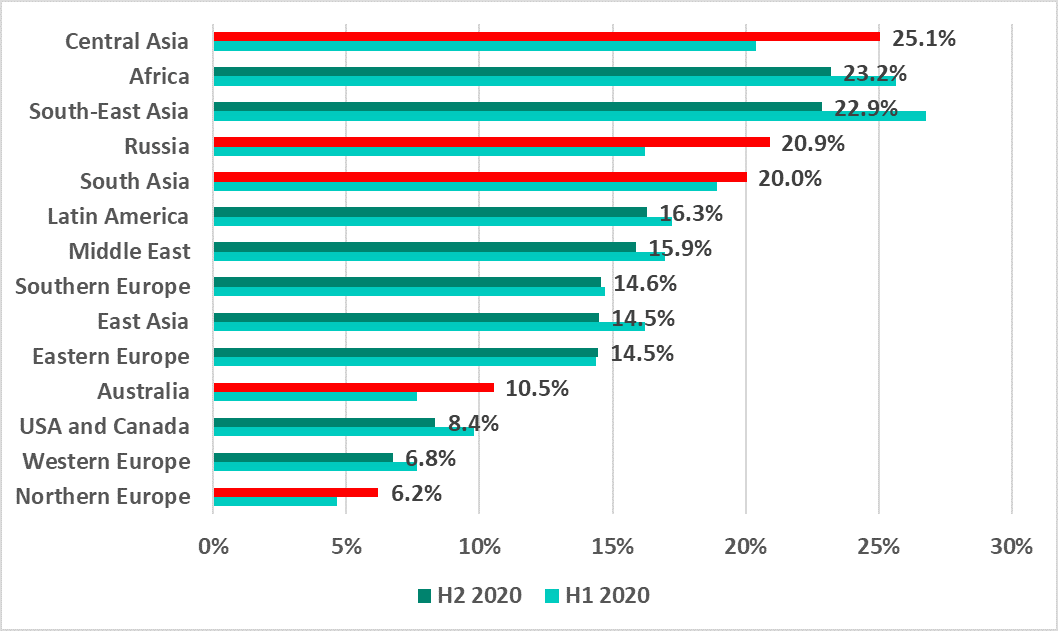
Asia and Africa are still leaders in the ranking of global regions based on the percentage of ICS computers on which malicious activity was prevented.
In Southeast Asia and East Asia, the percentage of attacked ICS computers decreased compared to the previous half-year (just like in past years).
A small reduction was also observed in the US and Canada, and Western Europe, which are ranked nearly last.
In all other regions of the world, the percentage of ICS computers on which malicious objects were blocked increased over the half-year. This includes Northern Europe, which is the most secure region according to this indicator.
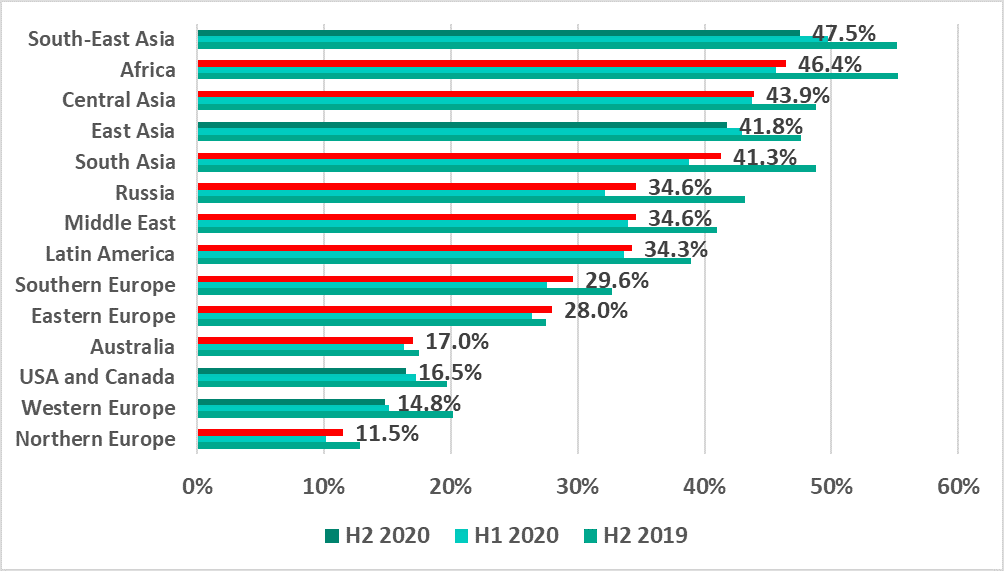
Russia gained 2.4 p.p. and occupied sixth place in the ranking, remaining behind the leading regions of Asia and Africa.
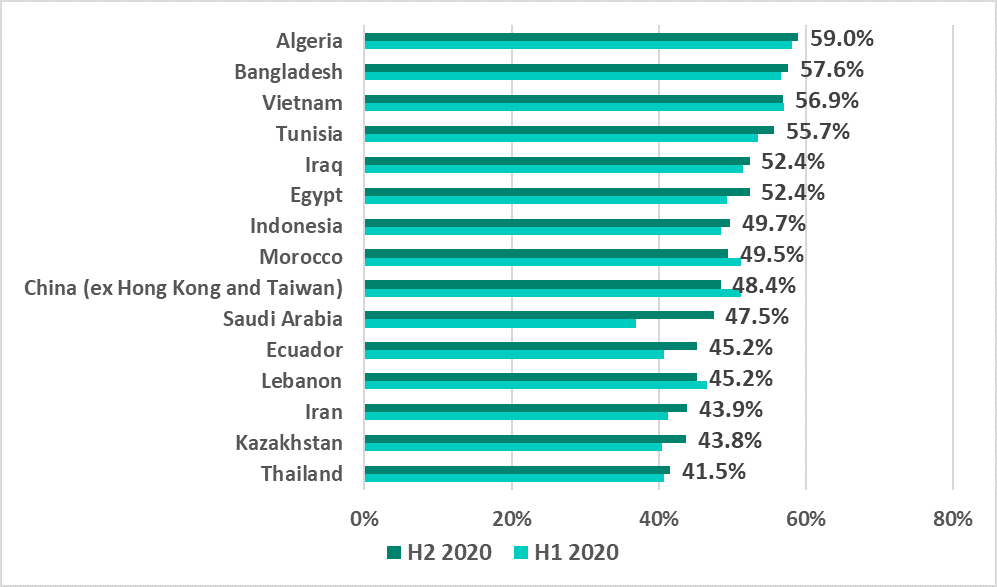
Top countries
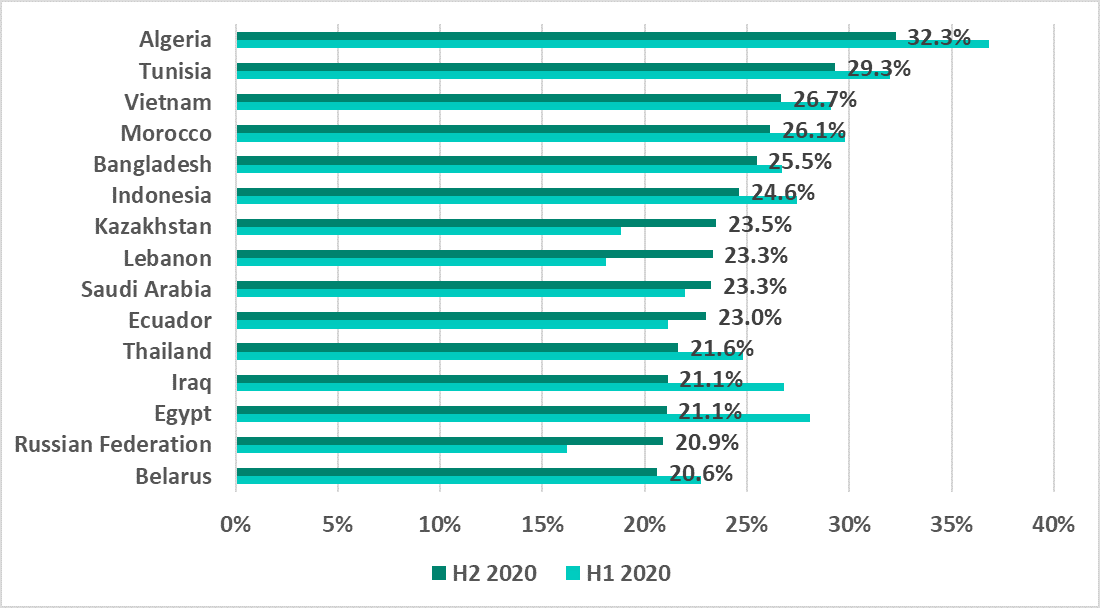
In H2 2020, no European country made it into the top 15 countries and territories ranked by percentage of attacked ICS computers.
Israel ranked first on the list of the 10 most secure countries in H2 2020 with a record low of 4.3%.
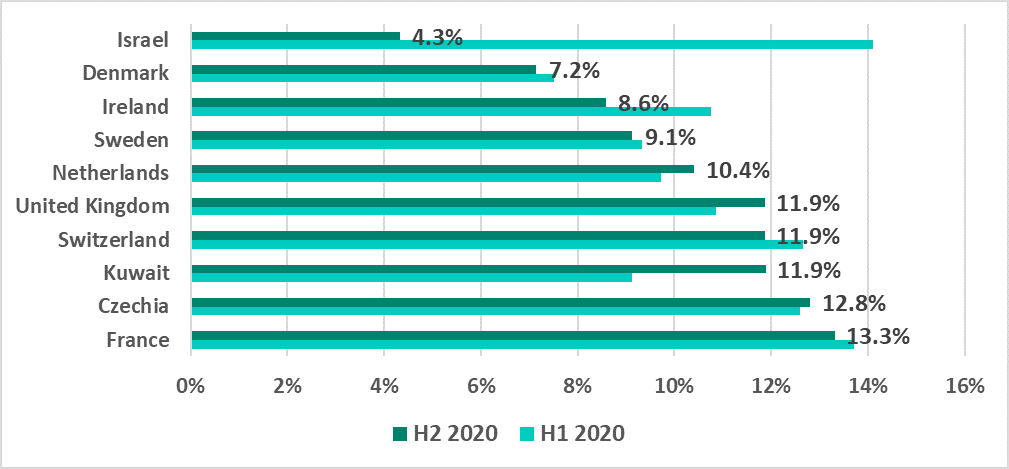
Israel and Kuwait made it into the top 10 countries with the minimal percentage of attacked ICS computers, just as in H1 2020. All other countries in this top 10 are European.
Main threat sources
In recent years, the internet, removable media and email have been the main sources of threats for computers in the industrial infrastructure of organizations.
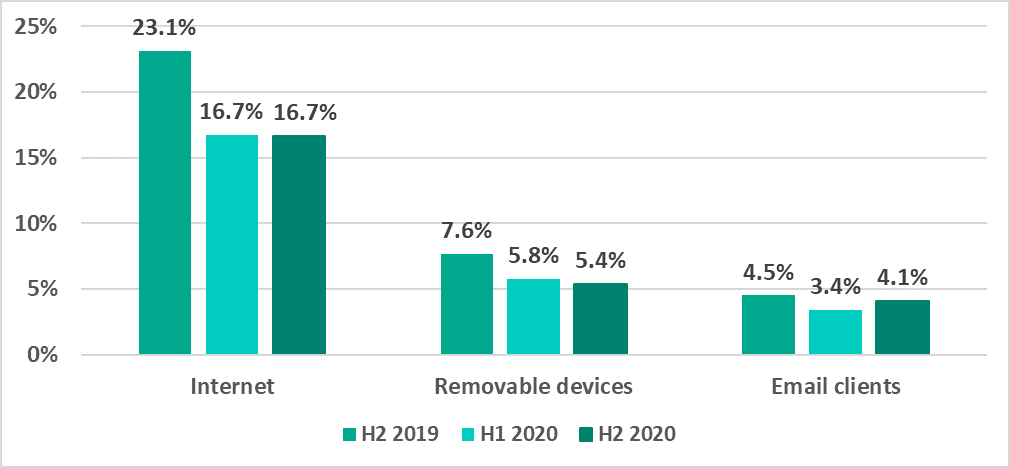
H2 2020:
- Internet threat indicators were unchanged.
- The percentage of ICS computers on which threats were blocked when removable media was connected to them decreased by 0.4 p.p.
- The percentage of ICS computers on which malicious email attachments were blocked increased by 0.7 p.p.
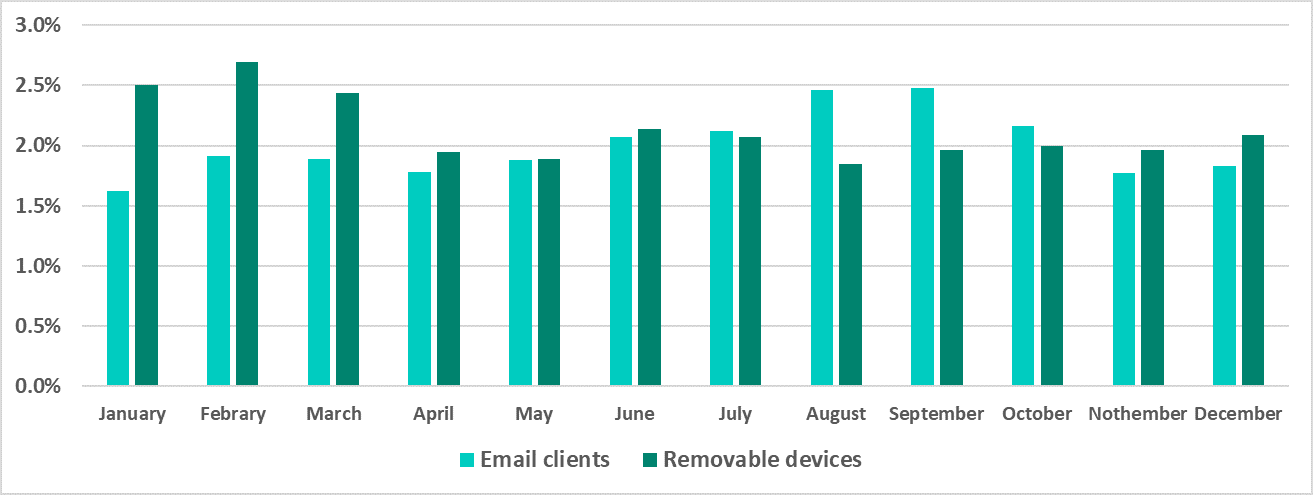
The peak of threats blocked in email occurred in August and September, while the peak of threats that were blocked when connecting removable media occurred in the first quarter of 2020.
Main threat sources: geographical distribution
In H2 2020, the indicators for malicious email attachments exceeded the indicators for removable media in all regions of Europe, in the US and Canada, in Australia, and (in contrast to the previous half-year) in Latin America.
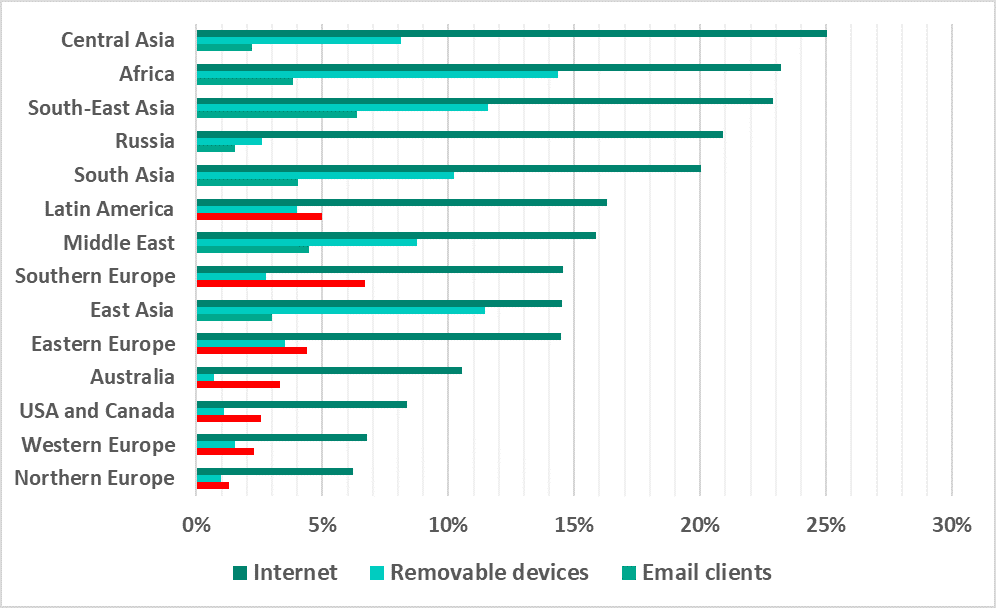
As in previous years, the internet remains the main source of threats.
Internet
The percentage of ICS computers on which threats from the internet were blocked decreased from H2 2019. In H2 2020, it increased in multiple regions at the same time, including Northern Europe, which ranks last according to this indicator.
In H2 2020, the percentage of ICS computers on which threats from the internet were blocked increased in 39% of countries. The equivalent indicator of H2 2019 was 14.5%.
The maximum increase of 4.7 p.p. was recorded in Kazakhstan and in Russia. As a result, Russia made it back into the top 15 countries for this indicator.
Removable media
The percentage of ICS computers on which malware was blocked when removable media was connected to them increased in East Asia and the Middle East, and increased slightly in Western and Northern Europe.
In H2 2020, the percentage of ICS computers on which malware was blocked when removable media was connected to them increased in 39% of countries (in H2 2019, it increased in 30.9% of the countries).
Among all the countries, the highest growth in this indicator (4.3 p.p.) was observed in Saudi Arabia.
Like in H1 2020, countries of North America, Europe and Australia did not make it into this list in H2 2020.
Email clients
The percentage of ICS computers on which malicious email attachments were blocked in H2 2020 increased in all regions except East Asia, the US and Canada, Western Europe and Russia.
Southeast Asia was once again the highest ranked region for this indicator over the half-year.
Russia turned out to be one of the most secure regions for this indicator, ranking second to last.
The dynamics of malicious email attachments in various countries of the world were perhaps the most dramatic. In H2 2020, the percentage of ICS computers on which email attachments were blocked increased in 73.4% of all countries. This is three times larger than the corresponding indicator for 2019 (23.6%).
This indicator increased for all the countries ranked in the top 15 based on the percentage of ICS computers on which malicious email attachments were blocked.
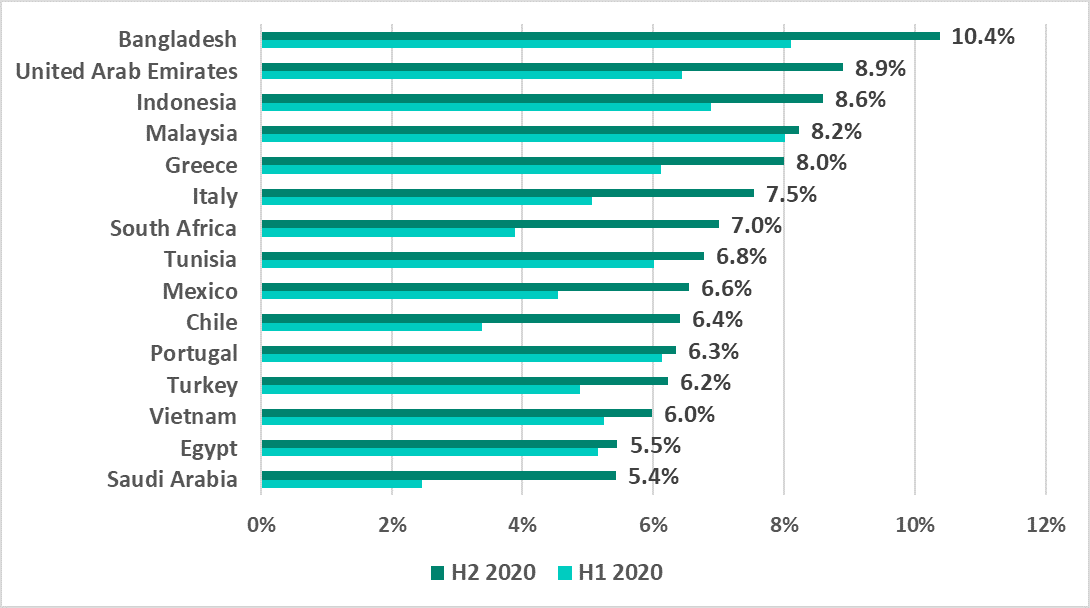
This ranking notably includes countries of Southern Europe – Portugal, Greece and Italy.
The variety of malware detected
In H2 2020, Kaspersky security solutions blocked over 19,400 malware variants from 5,365 different families on industrial automation systems.
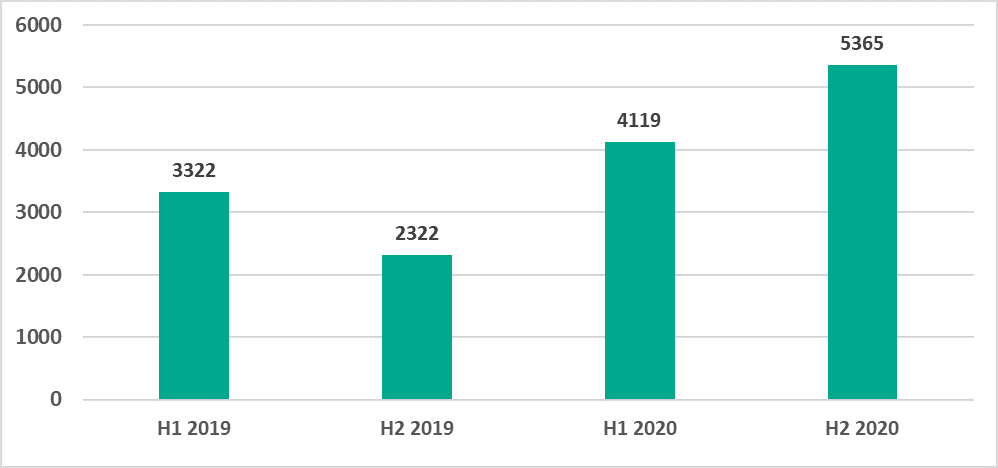
After this indicator decreased in H2 2019, the number of malware families increased in 2020. We have observed larger numbers of families of the following types of malware: backdoors, Trojans/spyware, malicious scripts and documents, and .NET malware.
Categories of malicious objects
The results of our detailed analysis revealed the following estimated percentages of ICS computers on which the activity of malicious objects from various categories was prevented:
(In many cases, two or more types of threats may have been blocked on a single computer during the reporting period; therefore, the resulting percentages should not be added together.)
H2 2020 saw an increase in the percentage of ICS computers on which the following threats were blocked:
- Internet threats – web resources involved in the distribution or management of malware (+2.5 p.p.), and malicious scripts and redirects on web resources (JS and HTML) (+1.6 p.p.).
- Typical threats distributed over email – malicious MS Office and PDF documents (+1.2 p.p.).
- Spyware – Trojans, backdoors and keyloggers (+1.4 p.p.).
- Miners – executable files for Windows (+0.7 p.p.).
A brief description of each type of threat is provided in a separate document.
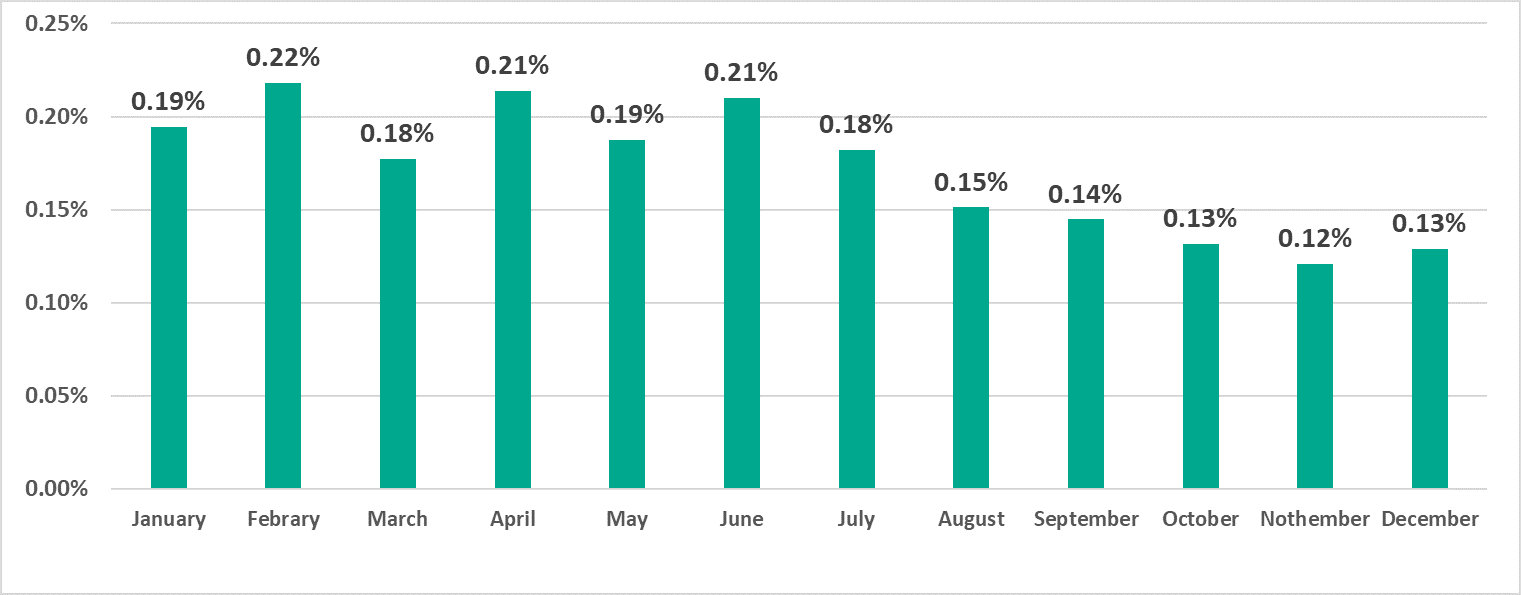
Ransomware
In 2020 overall, ransomware infection attempts were blocked on 0.77% of ICS computers.
This type of malware was blocked on 0.63% of ICS computers in H1 2020, and was blocked on 0.49% of computers in H2 2020.
This indicator fluctuated between 0.18% and 0.22% during the first half of the year, but it steadily decreased to 0.12% in November and 0.13% in December during the second half of the year.
Southeast, South and East Asia led with a noticeable margin in the regional ranking by the percentage of ICS computers attacked by ransomware.
In most regions, along with the overall global trend, the percentage of ICS computers on which ransomware was blocked decreased in H2 2020.
However, this indicator significantly increased in several regions:
- US and Canada – +0.25 p.p.
- Australia – +0.23 p.p.
- Western Europe – +0.13 p.p.
Countries in these regions are traditionally considered to be developed countries, and in similar rankings they had never been as high as they were in H2 2020.
Asian countries still make up the majority of the countries in the top 15 ranked by percentage of ICS computers on which ransomware was blocked.
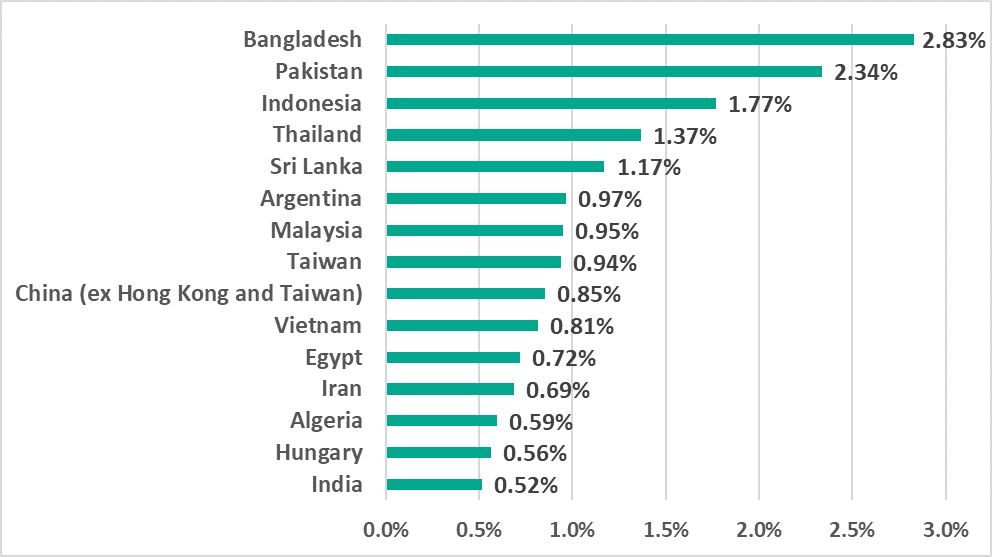
The only European country was Hungary, which made it into this top 15 for the first time.
We will prepare a separate report for this malware category.
1 We recommend that organizations that have any restrictions in place with respect to transferring data outside the organization’s perimeter consider using the Kaspersky Private Security Network service.