10 September 2025
Dynamics of external and internal threats to industrial control systems. Q2 2025
Q2 in numbers
|
Parameter |
Q1 2025 |
Q2 2025 |
Quarterly changes |
|
Global percentage of attacked ICS computers |
21.9% |
20.5% |
▼1.4 pp |
|
Percentage of ICS computers on which malicious objects |
|||
|
Malicious scripts |
7.16% |
6.49% |
▼0.67 pp |
|
Denylisted internet resources |
5.12% |
5.91% |
▲0.79 pp |
|
Spy Trojans, backdoors |
4.20% |
3.84% |
▼0.36 pp |
|
Malicious documents |
1.85% |
1.97% |
▲0.12 pp |
|
Viruses |
1.53% |
1.29% |
▼0.24 pp |
|
Worms |
1.31% |
1.22% |
▼0.09 pp |
|
Miners in the form |
0.78% |
0.63% |
▼0.15 pp |
|
Web miners running in browsers |
0.53% |
0.30% |
▼0.23 pp |
|
Malware for AutoCAD |
0.34% |
0.29% |
▼0.05 pp |
|
Ransomware |
0.16% |
0.14% |
▼0.02 pp |
|
Main threat sources |
|||
|
Internet |
10.11% |
9.76% |
▼0.35 pp |
|
Email clients |
2.81% |
3.06% |
▲0.25 pp |
|
Removable media |
0.52% |
0.37% |
▼0.15 pp |
|
Network folders |
0.07% |
0.05% |
▼0.02 pp |
Changes over the quarter
In Q2 2025, the balance of power in the fight against cyberthreats continued to shift in favor of industrial enterprises — primarily due to the implementation of proactive protection measures and the blocking of threats at early stages. The percentage of ICS computers on which malicious objects were blocked decreased to 20.5% — the lowest level in the past several years.
From a practical perspective, the level of danger posed by a specific threat to an ICS computer and the OT network as a whole depends on the context, which is determined by the answers to the following questions:
- At which stage in the kill chain was the threat blocked? Was it just a downloader, or did it get to the stage of a ransomware encryptor?
- Was the threat blocked at the network perimeter or deep inside the network?
Strictly speaking, the network perimeter comprises not only the systems directly accessible from the internet (of which, incidentally, there are very few left), but also all computers within the OT environment (including laptops) that have internet access, that is, access to websites, messengers, and email. Thus, if a threat is blocked when attempting to access a malicious web address, when downloading a malicious object from the internet, or when a user opens a phishing message from email, the protected computer can be considered to be located at the network perimeter.
Threats obviously pose a higher risk if they are blocked inside the OT network rather than at the perimeter. “Inside the OT network” usually means that a threat has been detected and blocked in one of the following locations:
- in the RAM of an OT computer;
- on its hard drive;
- on a network drive;
- on a USB device connected to it.
An increase in malicious activity in parts of the OT network where information from the internet is only available offline (distributed via removable media and network drives) is a sign that threats are penetrating deeper into the network — for example, during a phishing campaign or a surge in virus propagation. This is a clear signal to consider how these threats managed to get inside and why they were not blocked at earlier stages. Perhaps not all computers on the OT network are reliably protected, and not all cybersecurity policies are effectively enforced.
In this report, we present an analysis of the threat landscape for ICS computers, taking into account the context that is essential for understanding the issues associated with ensuring security in OT — that is, for taking the first step towards resolving these issues.
Sets of threats in the industrial network
As mentioned above, the level of danger posed by a threat largely depends on the context.
To track the penetration of various threats from the perimeter deeper into the network, we divided the ICS computers on which threats were blocked in Q2 2025 (20.5% of all ICS computers) into three sets.
- “Set of external threats” — ICS computers on which only external threats delivered via the internet and corporate email were blocked. It can be assumed that, despite being exposed to external threats, these computers were sufficiently well protected. No lateral movement occurred. Clearly, efforts should be made to reduce the size of this set to decrease the attack surface and reduce the likelihood of attacks progressing further. Such systems make up 8.94% of all ICS computers.
- “Borderline set” — ICS computers on which both external and internal threats were blocked. They are also part of the network perimeter. However, protection against initial penetration attempts may not have always worked effectively on these computers. These computers may have been exposed to newer or more sophisticated attack vectors. Greater attention should be paid to such computers to understand the causes of this situation and eliminate the possibility of the OT network being compromised. There may already be signs of a cybersecurity incident. These systems make up 3.35% of all ICS computers.
- “Set of internal threats” — ICS computers on which only internal threats were blocked in RAM, on local, removable, or network drives. Regardless of their proximity to the network perimeter, these computers proved to be accessible for lateral movement. Some of them may, in fact, belong to the second (borderline) set, since it is not always possible to determine the true penetration vector (for example, when downloading an encrypted document or a password-protected archive, signs of a threat can only be detected after attempting to decrypt or extract the files). All such cases must also be categorized and handled by the organization’s cybersecurity team, depending on the type of threat detected and the nature of the information systems. These systems make up 8.23% of all ICS computers.
Statistics for each of these segments, both individually and in comparison, help to understand the ICS threat landscape better and identify the factors that affect it.
The diagram below shows changes in the percentages of ICS computers on which threats were blocked for each of the three sets. We used two axes on the diagram to help assess the contribution of each set to the overall percentage of attacked ICS computers:
- the left axis and the line chart values show the percentages of ICS computers on which malicious objects were blocked across all sets;
- the right axis and the histogram bars show changes in the percentage of ICS computers (quarter-over-quarter differences) for each set individually, as well as the totals across all sets:
- light green — set of external threats
- gray — borderline set;
- dark green — set of internal threats;
- red — all sets combined.
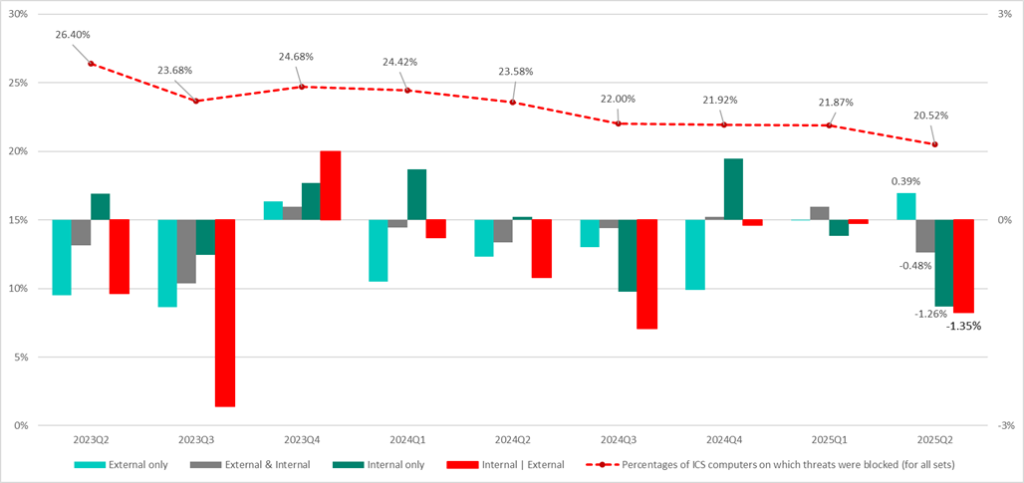
The diagram shows that the decrease in the percentage of attacked ICS computers in Q2 2025, against the backdrop of growth in the set of external threats, was driven by a decline in the percentage of attacked ICS computers belonging to the borderline set and the set of internal threats.
Next, we examine the categories of threats in each of these sets – this can provide some help in determining the stage in the kill chain to which each blocked threat belongs.
Threat categories
When access to a malicious web address, web script, phishing page, or email attachment is blocked on a computer, this is likely evidence of the initial stage of an attack. At the same time, blocking scripts for popular interpreters (such as wscript, cmd, vbs, PowerShell, Python, AutoList, etc.), spyware, cryptominers, and ransomware may indicate a later stage of an attack.
Before moving on, we need to note three considerations:
- Not all threats can be classified and assigned an exact category — ICS computers on which such threats were blocked are presented in this report as a separate group, “Threats of undetermined types.”
- One threat category only was blocked on more than half of the ICS computers attacked during the quarter. This means that the Monte Carlo method can be used to assess which threat categories the threats of undetermined types are most likely to belong to.
- Threats of different categories were blocked on slightly fewer than half of the ICS computers attacked during the quarter. These computers represent the most problematic area in terms of cybersecurity, since in many cases the presence of multiple different threats indicates hidden malicious activity. In this report, they are presented as a separate group, “Combination of two or more threat categories.”
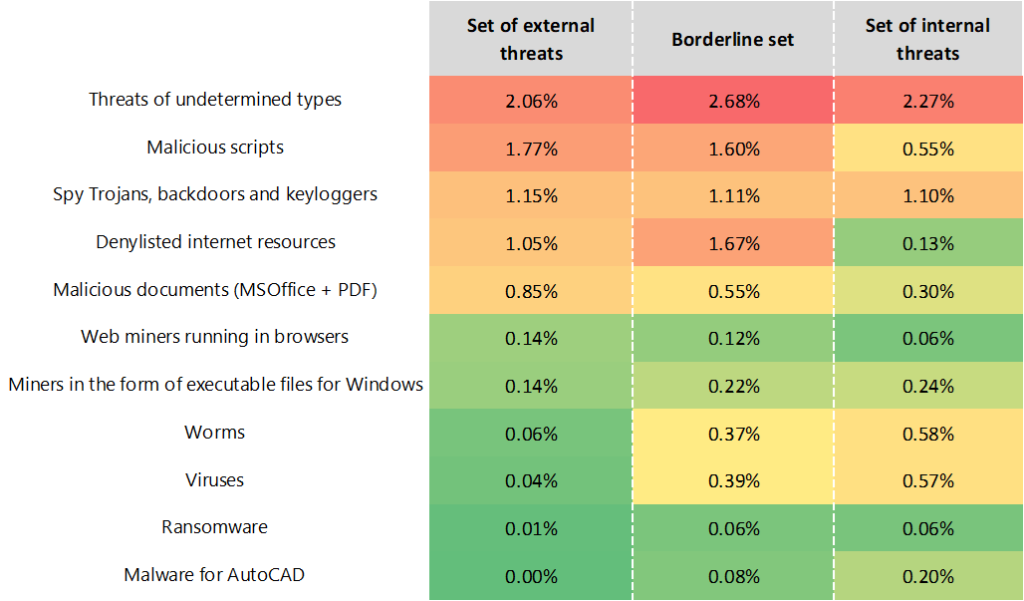
The heat map below shows different categories of malware, categorized by the sets of ICS computers described above. The percentage values in the cells represent the percentages of ICS computers on which the corresponding threats were blocked in the respective sets. The sum of percentages across all categories in all segments is equal to 20.5% — the total percentage of ICS computers on which malware was blocked in Q2 2025.
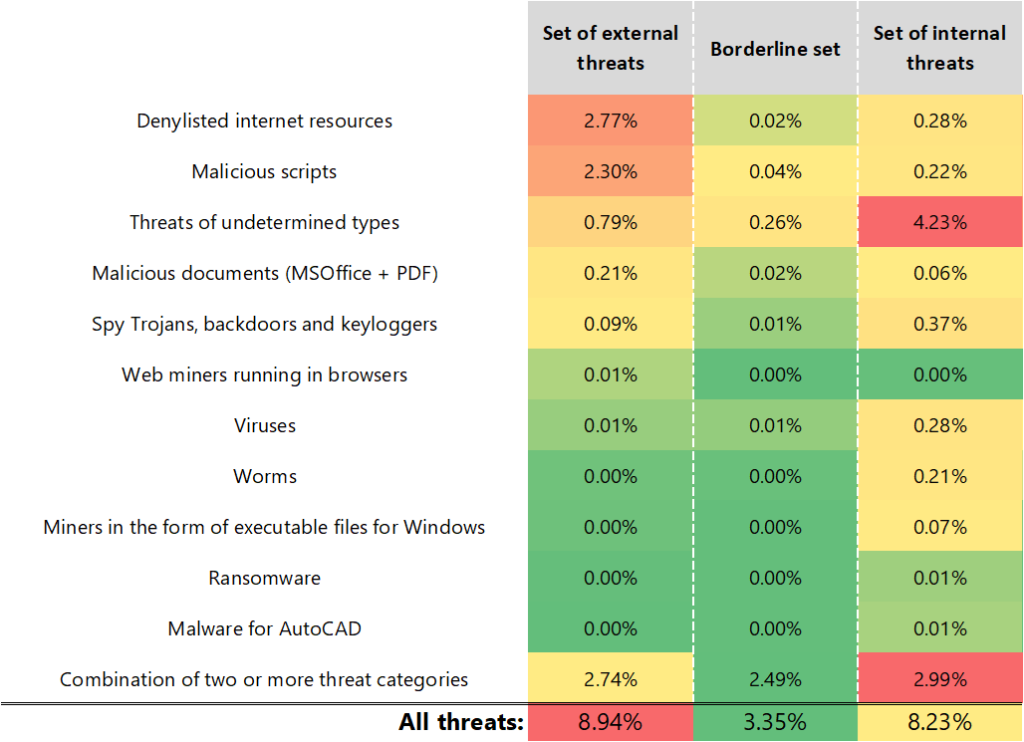
The heat map demonstrates that different types of threats are distributed unevenly across the three sets.
Thus, there is a significant majority of initial-stage threats on computers in the set of external threats, while the set of internal threats contains more next-stage malware, with some malware hidden among threats of undetermined types.
This distribution illustrates the process by which next-stage threats penetrate deeper into the network — that is, the transition from the initial penetration stage to the next stage, and in cases where ransomware is blocked, to the final stage.
We will now examine how the percentage figures for malware categories on ICS computers in each individual set changed quarter over quarter.
External threats
First, let’s consider the statistics obtained from computers in the set of external threats — that is, the group of ICS computers on which only external threats (from email or the internet) were blocked.
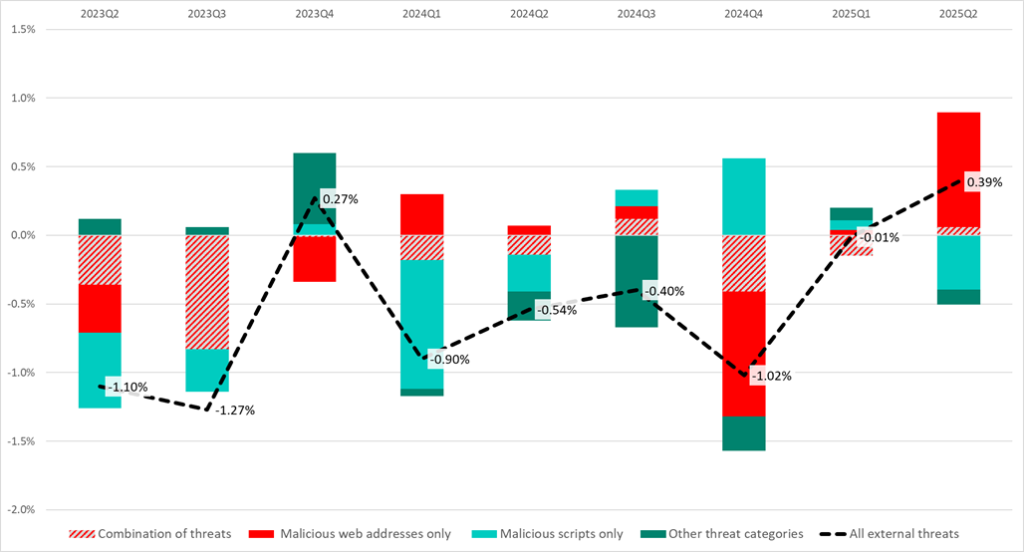
In Q2 2025, the percentage of ICS computers on which only external threats were blocked increased by 0.39 p.p. compared to Q1.
The diagram below shows how this percentage changed quarter over quarter (black dashed line). It also shows the threat categories that had the greatest impact on the percentage of external threats:
- malicious web addresses (values marked in red);
- malicious scripts (values marked in light green).
The contribution of ICS computers on which other malware categories were blocked — malicious documents only, spyware only, cryptominers only, etc. — was small, so they are combined into the “Other threat categories” group (marked in dark green) in the diagram below.
The percentage figures for ICS computers on which threats of two or more categories were blocked during the quarter are marked on the diagram as “Combination of threats” (red hatching).
The increase in the percentage of malicious web addresses is due to Kaspersky denylisting a large number of direct links to malicious code hosted on servers of public internet platforms, messengers, and file-sharing services.
For attackers, creating a large number of unique links to malware stored on legitimate public resources and accessible at a specific web address is a straightforward task. All it takes is registering an email account or buying a virtual phone number.
Detecting new malicious links, on the other hand, is much more complex and resource-intensive. For example, to identify a new malicious link, one must either capture the malware sample delivered via that link or detect and analyze a malware sample that uses the link.
The diagram below shows changes in the percentages of ICS computers on which the following were blocked:
- malicious web addresses only (red dashed line);
- malicious scripts only (green dashed line);
- combined percentage values for ICS computers in both groups (black dashed line).
Changes in the percentage values for ICS computers in the corresponding groups are shown in the histogram (red and green bars).
The diagram illustrates the fluctuations in percentage values over one or two quarters, starting from Q3 2023, reflecting the life cycle of two types of attacks (green line above the red), during which different initial infection techniques were employed. This dynamic is obviously influenced not only by the capabilities of attackers but also by changes in threat detection methods.
For example, in Q4 2023, WordPress vulnerabilities were actively exploited to infect websites as part of a malicious campaign known as Balada Injector. Consequently, the percentage of ICS computers on which malicious web addresses were blocked increased.
In Q4 2024 and Q1 2025, phishing scripts designed to infect users with spyware were actively spreading. This malicious campaign is known as FakeCaptcha and ClickFix. Consequently, the percentage of ICS computers on which malicious scripts were blocked increased.
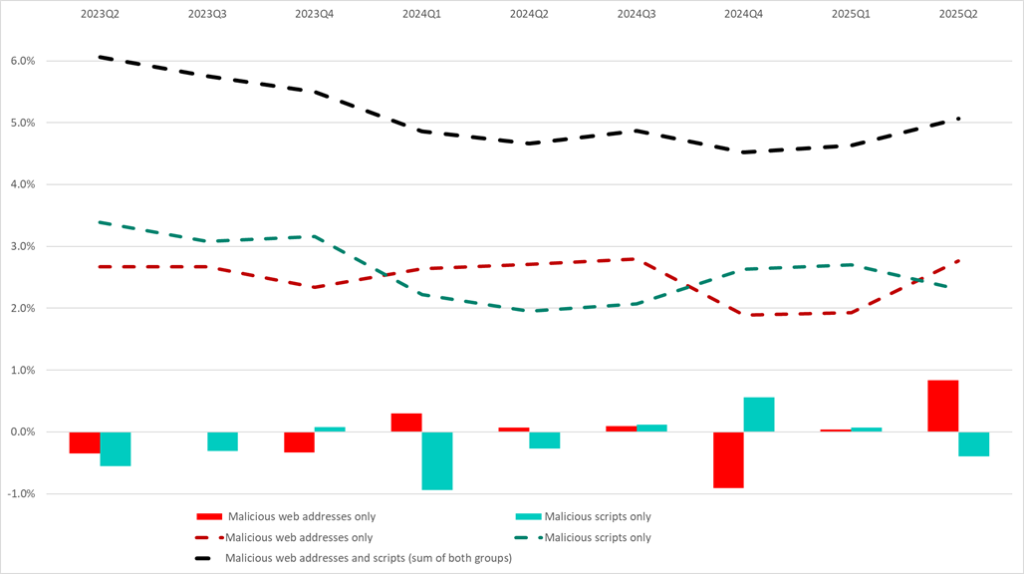
The diagram demonstrates that the percentage values of these two groups are interrelated. The decrease in the “malicious scripts only” group is largely due to the blocking of web addresses used to host scripts for creating phishing pages and pop-up messages. This type of phishing — disguised as CAPTCHA, tech support requests, police messages, and so on — is actively used by attackers to persuade users to follow instructions for self-infecting their computers (including with popular legitimate remote administration applications, known as Remote Access Tools).
Internal threats
Next, we look at the statistics in the segment of internal threats. In Q2 2025, the percentage of attacked ICS computers in this segment decreased by 1.26 p.p. A significant contribution to this change, as shown in the diagram below, came from computers on which the following were blocked:
- two or more threat categories (combination of threats, red hatching);
- threats of undetermined types (gray).
In addition, the diagram separately shows the contribution of the category “malicious web addresses only” (red).
It is essential to clarify here that the malicious web address category in the internal OT segment, where internet and email may not be available, includes malicious addresses detected while scanning the system registry, rather than those blocked when attempting to access the internet.
It can be stated that ICS computers in the set of internal threats may become exposed to external threats. For example, during maintenance, a computer that normally doesn’t have internet access may temporarily gain it. The same applies to engineering laptops, which may connect to the networks of various facilities, as well as to corporate and public networks.
Such computers are often more vulnerable to internet and email threats than computers from the set of external threats, simply because “internal” ICS computers run outdated software that cannot be updated, is not cost-effective to update, or is not considered a priority.
The percentages of other threat categories changed only slightly, and their total contribution to the overall change amounted to just -0.07 p.p.
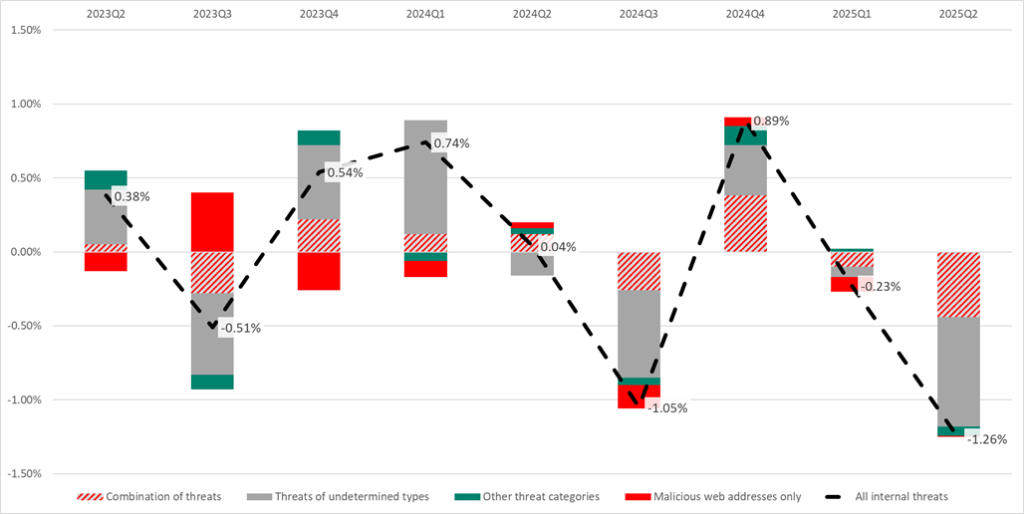
The diagram also shows the following features:
- the cyclic rise and fall across all threats, which is characteristic of the activity cycles of self-propagating malware (local infections);
- the influence of malicious web addresses on changes in the percentages of all attacked computers in the internal threats set is chaotic and diminishing; this category is less similar to the group of threats of undetermined types;
- the noticeable impact of threats of undetermined types, as well as combinations of several threats, on the overall percentage of attacked computers in the set of internal threats;
- the positive correlation (R=0.8, p<0.005) between the group of computers on which only threats of undetermined types were blocked and the group of computers with combinations of threats — in other words, these are likely to be very similar ICS computers.
If we compare changes in the percentage values for the categories Viruses, Spyware, and Worms with changes in the percentage of ICS computers on which only undetermined threats were blocked, we find a high degree of similarity (in the case of viruses, the correlation coefficient is R = 0.67, with p < 0.005). The same strong similarity is observed when comparing with ICS computers on which threats of different categories (combinations of threats) were blocked.
In the diagram below:
- the left axis and two shaded areas show the dynamics of changes in the percentage of ICS computers on which the following were blocked:
- threats of undetermined types (gray);
- combinations of different threats (red hatching);
- the right axis and lines show the dynamics of the percentage of ICS computers on which the following threat categories were blocked:
- spyware;
- viruses;
- worms.
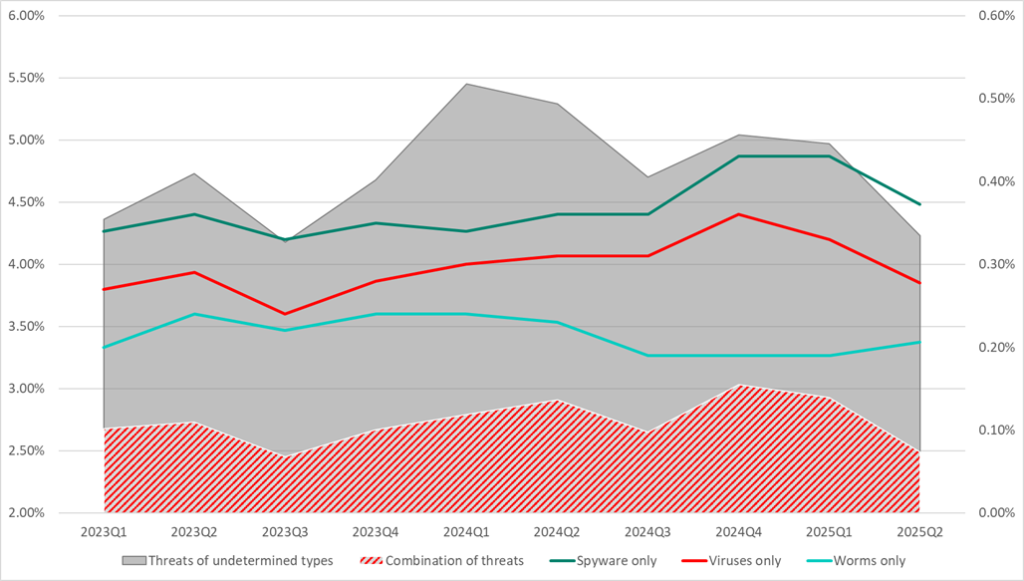
Thus, in cases where more than one threat is blocked on an ICS computer in the set of internal threats, or where the threat category is undetermined, it is highly likely that viruses, worms, and spyware are being blocked.
As a result, we can conclude that the decrease in the percentage of attacked ICS computers in Q2 2025 in the set of internal threats was driven by a decrease in the percentage of ICS computers infected with spyware and viruses.
It is also highly likely that the proactive blocking of malicious web addresses in the set of external threats, as well as various next-stage threats in the borderline set (see below in this report), helped reduce the amount of malware that penetrated deeper into the OT network.
The decrease in the percentage of viruses can be attributed in large part to the use of ICS computers in the sectors of construction, biometrics, and building automation in Russia, Asia, and the Middle East. This was primarily the result of a return to the steady downward trend in the proportion of viruses worldwide, following the peak of infections in the industries and regions listed above in Q4 2024. For more details, see the regional version of the report.
Borderline set
According to the statistics for ICS computers in the borderline set, the largest group consists of computers on which multiple threats were blocked at the same time, and to a lesser extent, computers on which only threats of undetermined types were blocked.
Blocking threats of undetermined types in the borderline set clearly indicates how these threats penetrate the network — via the internet and email in the borderline set.
The diagram below shows the changes in the percentage values of attacked ICS computers in these groups, quarter over quarter.
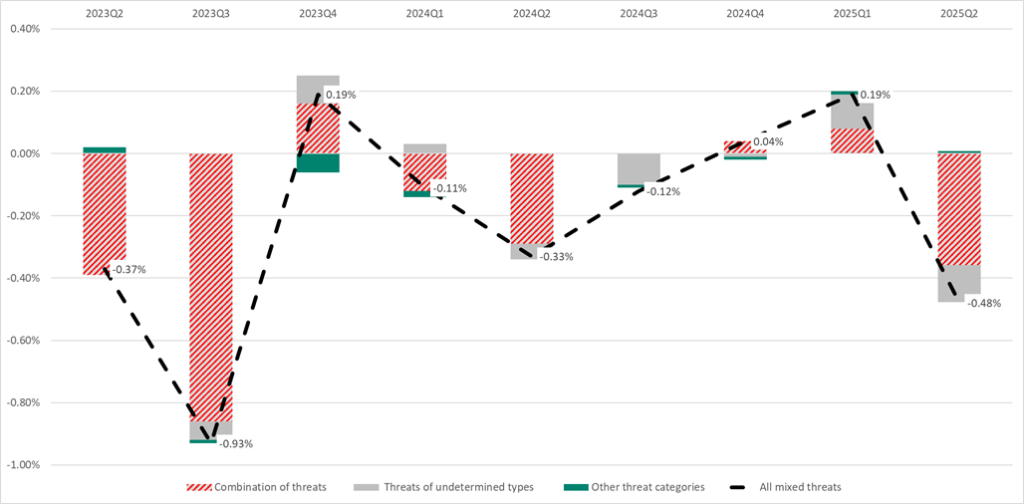
The diagram demonstrates that the primary contribution to changes in the percentage values for computers in the borderline set comes from ICS computers, on which more than one unique threat was blocked.
The heat map below shows which threat categories were blocked on computers where combinations of threats were detected.
It can be observed that computers with threats of undetermined types make up a significant part of the borderline set, as do computers on which malicious addresses and malicious scripts were blocked. In this case, these may literally be the same computers, as we are looking here at cases where threats from multiple categories were blocked on a computer during the quarter.
It is also worth noting that the percentages of viruses and worms are high in both the borderline set and the set of internal threats. In practical terms, this means that such computers may be involved in the distribution of spyware, viruses, and worms. Such distribution can occur either accidentally or deliberately — to carry out an attack via a supplier (supply chain attack) or a trusted partner.
Methodology used to prepare statistics
This report presents the results of analyzing statistics obtained with the help of Kaspersky Security Network (KSN). The data was received from KSN users who consented to its anonymous sharing and processing for the purposes described in the KSN Agreement for the Kaspersky product installed on their computer.
The benefits of joining KSN for our customers include faster response to previously unknown threats and a general improvement in the quality of detection by their Kaspersky installation achieved by connecting to a cloud‑based repository of malware data that is not transferable to the customer in its entirety by nature of its size and the amount of resources that it uses.
Data shared by the user contains only the data types and categories described in the appropriate KSN Agreement. This data helps to a significant extent in analyzing the threat landscape and serves as a prerequisite for detecting new threats including targeted attacks and APTs1.
Statistical data presented in the report was obtained from ICS computers that were protected with Kaspersky products and which Kaspersky ICS CERT categorized as enterprise OT infrastructure. This group includes Windows computers that serve one or several of the following purposes:
- Supervisory control and data acquisition (SCADA) servers
- Building automation servers
- Data storage (Historian) servers
- Data gateways (OPC)
- Stationary workstations of engineers and operators
- Mobile workstations of engineers and operators
- Human machine interface (HMI)
- Computers used to manage technological and building automation networks
- Computers of ICS/PLC programmers
Computers that share statistics with us belong to organizations from various industries. The most common are the chemical industry, metallurgy, ICS design and integration, oil and gas, energy, transport and logistics, the food industry, light industry, pharmaceuticals. This also includes systems from engineering and integration firms that work with enterprises in a variety of industries, as well as building management systems, physical security, and biometric data processing.
We consider a computer as attacked if a Kaspersky security solution blocked one or more threats on that computer during the period under review: a month, six months, or a year depending on the context as can be seen in the charts above. To calculate the percentage of machines whose malware infection was prevented, we take the ratio of the number of computers attacked during the period under review to the total number of computers in the selection from which we received anonymized information during the same period.
- We recommend that organizations subject to restrictions on sharing any data outside the corporate perimeter consider using Kaspersky Private Security Network. ↩︎