22 September 2025
Threat landscape for industrial automation systems. South and North America (Canada), Q2 2025
South America
Key cybersecurity issues in the region
High risk of targeted attacks
In South America, the percentage of ICS computers on which threats from email clients were blocked is 1.8 times higher than the global average. On this metric, the region ranks second globally.
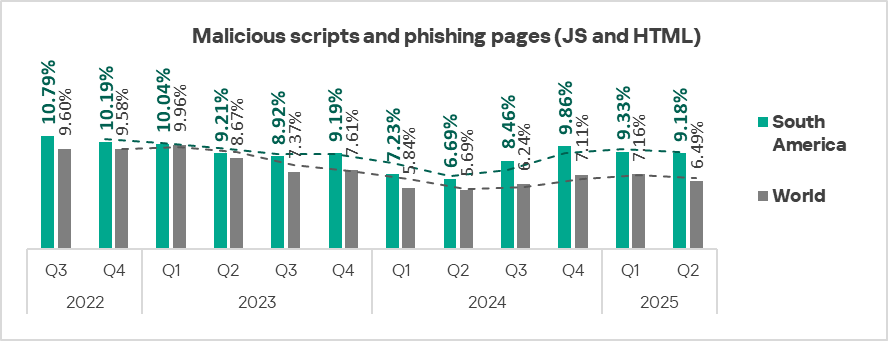
By the percentage of ICS computers on which malicious scripts and phishing pages were blocked, South America ranks first among regions globally, with a rate 1.4 times the global average.
Malicious scripts are used by attackers for a wide range of purposes — from data collection, tracking, and redirecting the user’s browser to malicious web resources, to downloading various malware into the system or browser (such as spyware, cryptominers, and ransomware). They spread both via the internet and through emails.
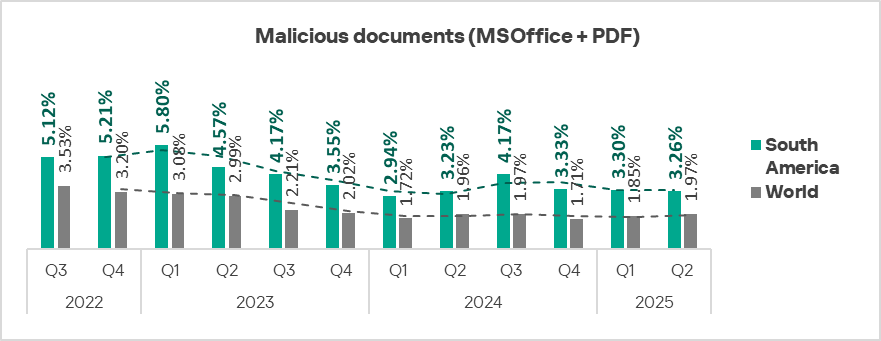
In terms of ICS computers on which malicious documents were blocked, South America ranks second globally, with a rate 1.7 times the global average.
Attackers distribute malicious documents in phishing emails and use them as an initial infection vector. Typically, such documents contain exploits, malicious macros, or harmful links.
High levels of email threats (phishing) and spyware clearly indicate that industrial OT systems in the region are highly exposed to advanced attackers.
Likewise, the large percentage of malicious scripts and phishing pages further demonstrates the high risk of targeted attacks against the technological infrastructures of industrial enterprises in the region. Many of these scripts and pages are aimed directly at stealing employee authentication data for corporate services.
High rate of spyware
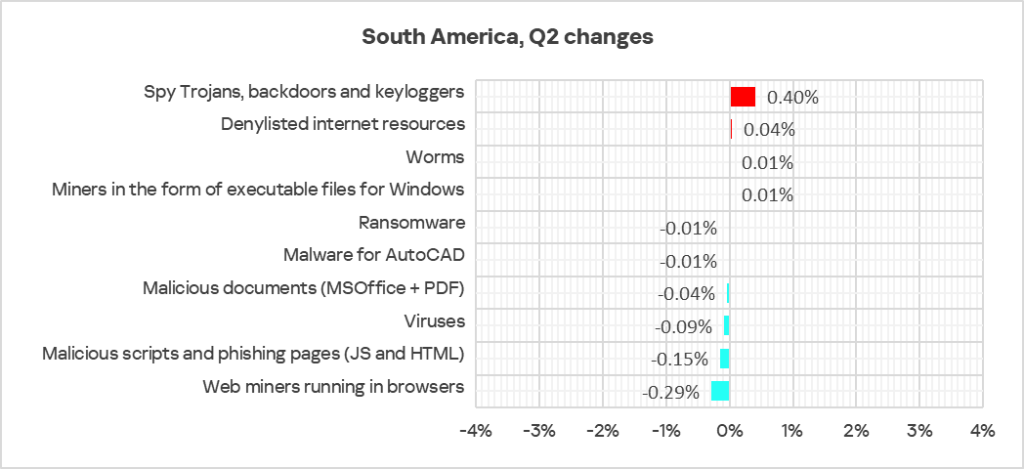
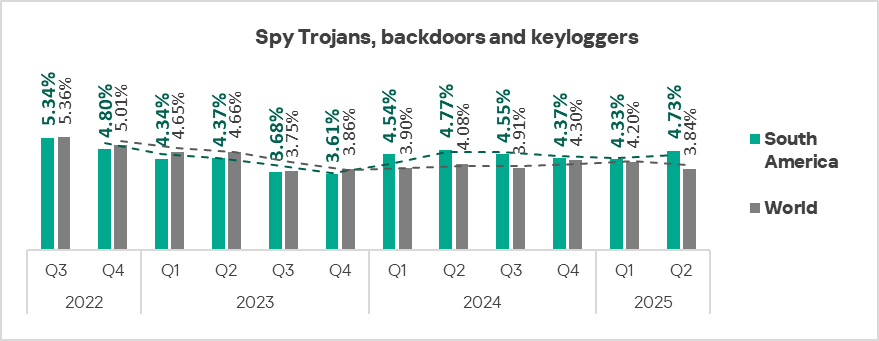
The percentage of ICS computers on which spyware was blocked in South America is 1.2 times higher than the global average. In the regional ranking of threat categories, spyware occupies second place. South America also leads globally in the growth rate of this category in Q2 2025.
Spyware is used by attackers to steal confidential data. In targeted attacks, it is also used for lateral movement within compromised networks and for downloading final-stage malware.
Statistics across all threats
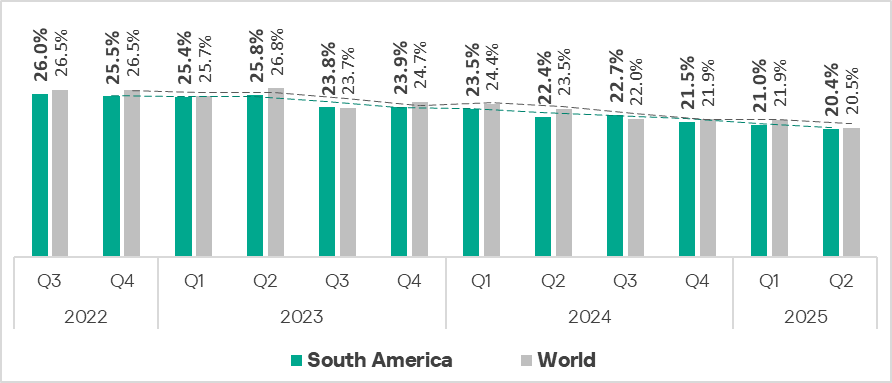
In Q2 2025, South America rose from eighth to fifth place globally in the percentage of ICS computers on which malicious objects were blocked. Nevertheless, the regional rate has declined for three consecutive quarters. In Q2 2025, it fell to 20.4% — slightly below the global average, but still 1.8 times higher than Northern Europe, the lowest-ranked region.
A downward trend is evident. The Q2 2025 figure for this metric is the lowest for South America since Q3 2022.
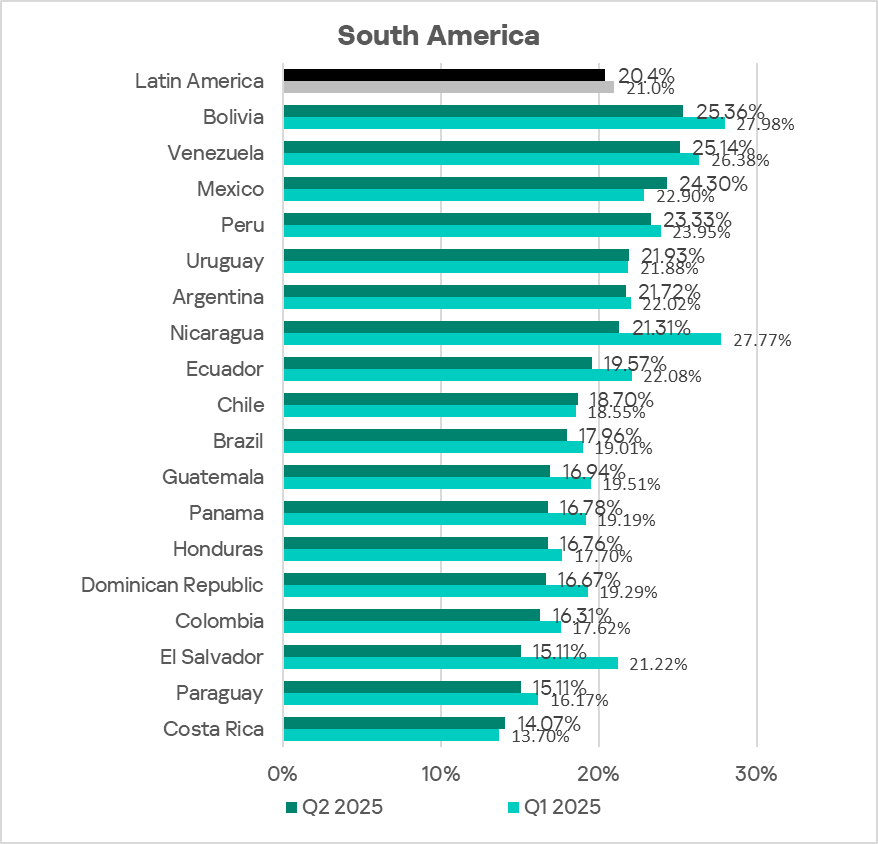
The percentage of ICS computers on which malicious objects were blocked varies among the region’s countries, from 14.07% in Costa Rica to 25.36% in Bolivia.
Threat sources
With the exception of mail clients, all threat source rates in South America are below the global average.
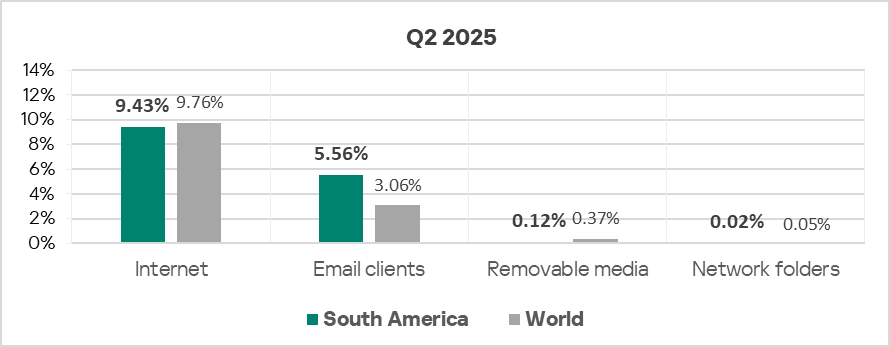
Malicious objects in the region spread primarily via the internet and email.
South America ranks second among regions in the percentage of ICS computers on which threats from email clients were blocked — 1.8 times the global average.
In Q2 2025, the percentage of ICS computers on which malicious objects were blocked fell across all threat sources except for mail clients.
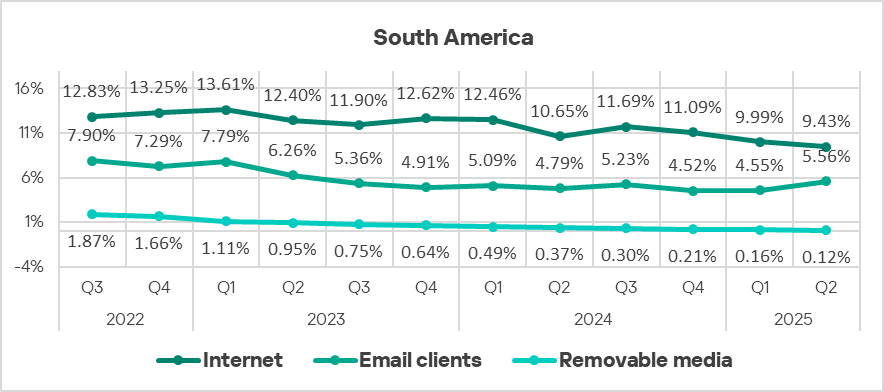
Internet
For ICS computers on which threats from the internet were blocked, South America ranks sixth among regions, with a rate 1.5 times higher than East Asia, which is lowest.
Rates among the region’s countries range from 6.00% in Costa Rica to 12.46% in Bolivia.
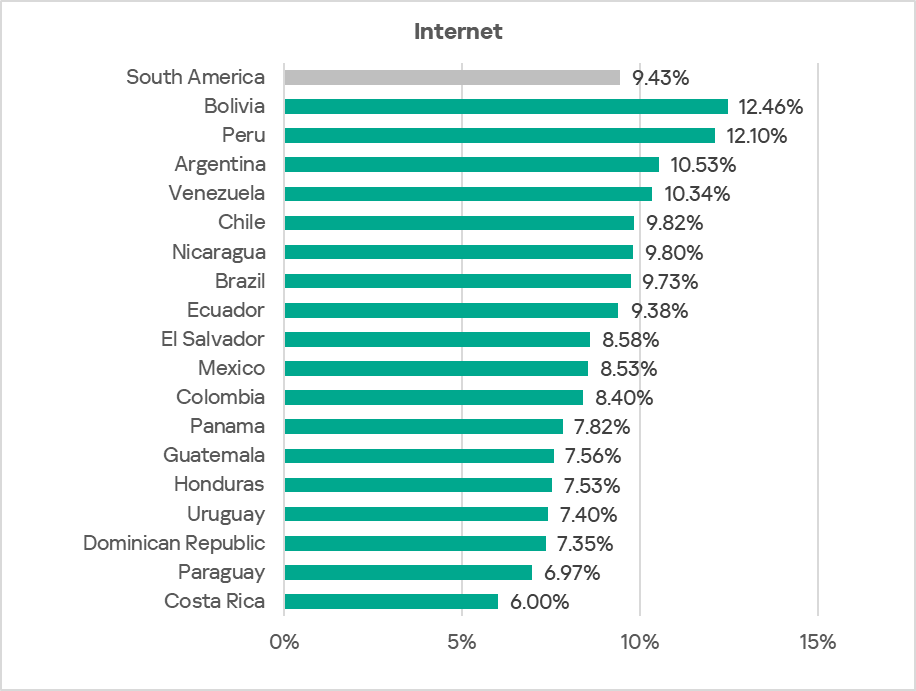
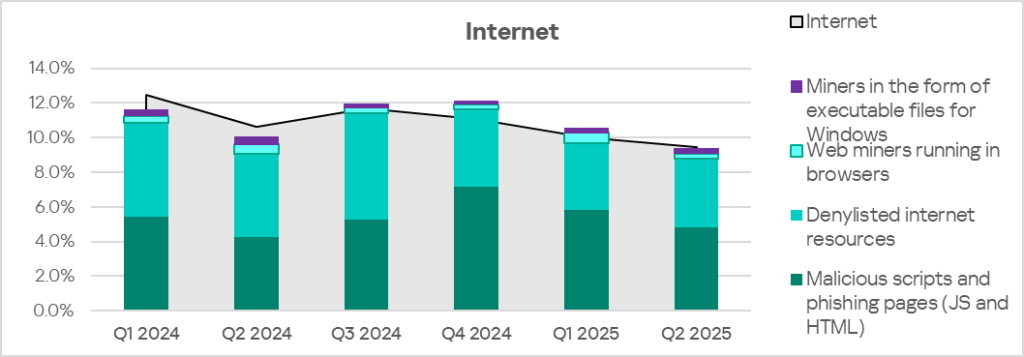
The main categories of internet threats blocked on ICS computers in the region are malicious scripts and phishing pages, denylisted internet resources, and miners.
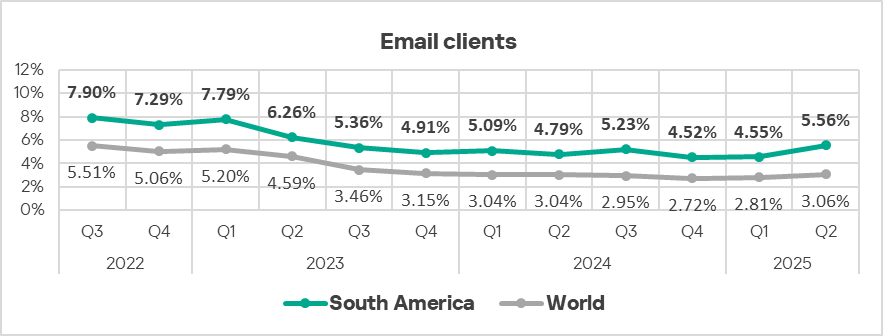
Email clients
By the percentage of ICS computers on which threats from email clients were blocked, South America ranked second among regions in Q2 2025, behind only Southern Europe. The region’s figure is seven times higher than in Russia, which ranks last.
In Q2 2025, the percentage of ICS computers on which threats from email clients were blocked increased in all regions except Russia. South America also has the highest growth rate for this threat source.
Combined with the high rates of scripts and phishing pages, this indicates that OT systems in the region are highly exposed to targeted attacks.
The email client figure has been rising in South America for two consecutive quarters, in line with global trends.
Among countries in the region, Mexico (11.21%) and Uruguay (10.61%) lead by a wide margin. Elsewhere, rates range from 2.40% in Venezuela to 5.80% in Argentina.
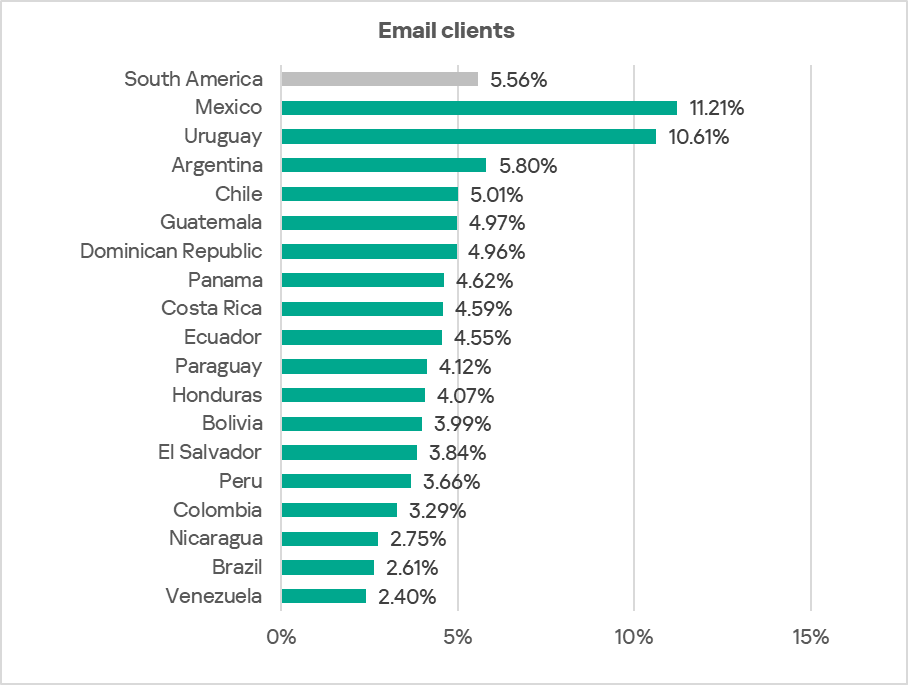
The main categories of email-borne threats blocked on ICS computers are malicious documents, spyware, malicious scripts, and phishing pages.
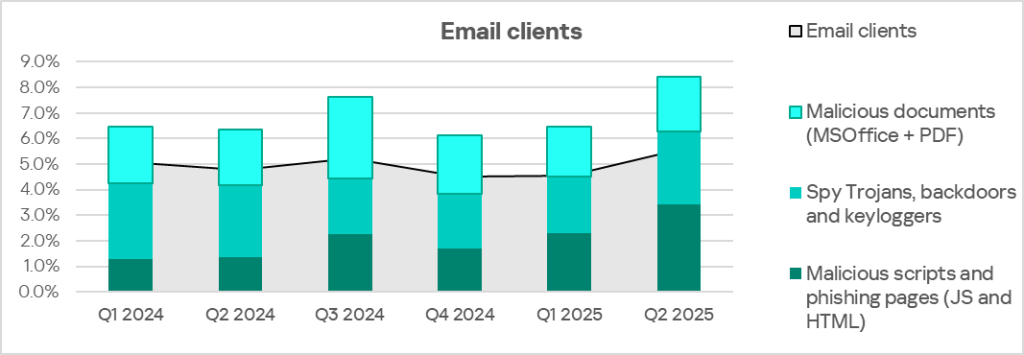
The top three countries for email client threats — Mexico, Uruguay, and Argentina — also rank high in spyware. Mexico and Argentina also lead in malicious scripts and phishing pages, while Uruguay and Mexico lead in malicious documents.
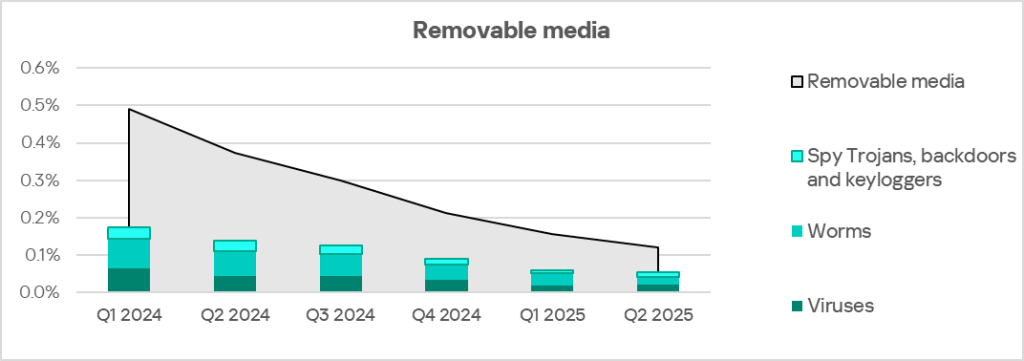
Removable media
In terms of ICS computers on which threats from removable media were blocked, South America ranked ninth among regions in Q2 2025. In North America (Canada), which ranks last, the rate is 4.5 times lower.
Among countries in the region, Venezuela leads by a wide margin in the percentage of ICS computers on which removable media threats were blocked, with 0.47%.
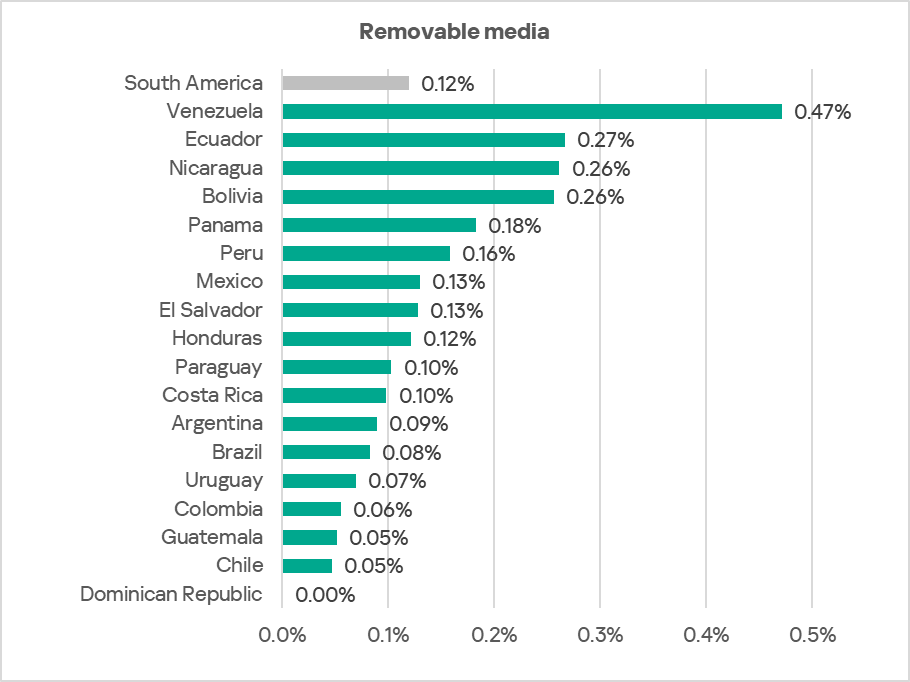
The main categories of threats blocked when connecting removable devices to ICS computers are viruses, worms, and spyware.
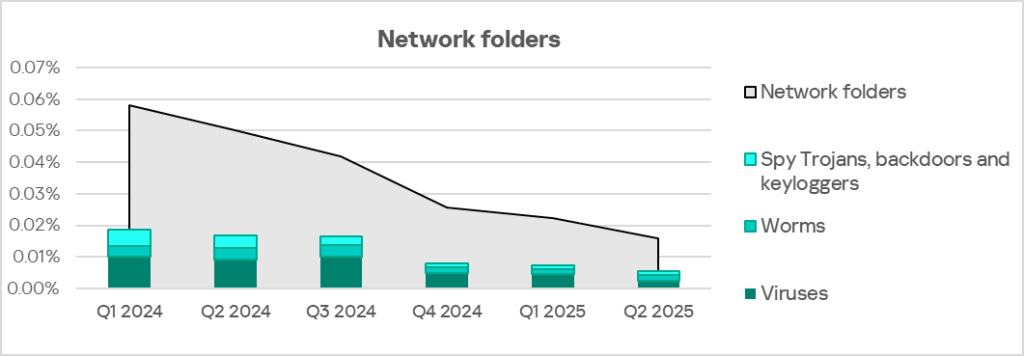
Network folders
South America ranks ninth among regions by the percentage of ICS computers on which threats from network folders were blocked, with 0.02%. Compared to Northern Europe, which ranks last, the rate is 1.6 times higher.
Among countries in the region, Nicaragua leads by a wide margin in this metric, with 0.13%.
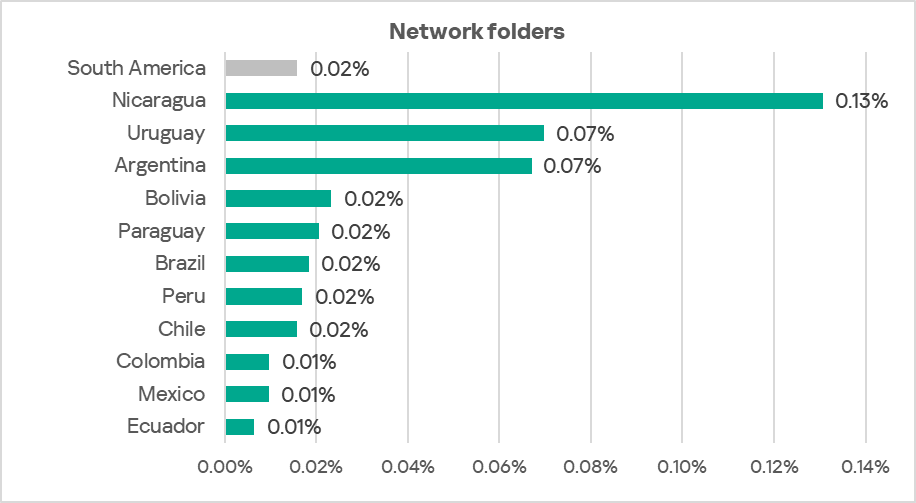
The main categories of threats spreading through network folders in the region are viruses, worms, and spyware.
Threat categories
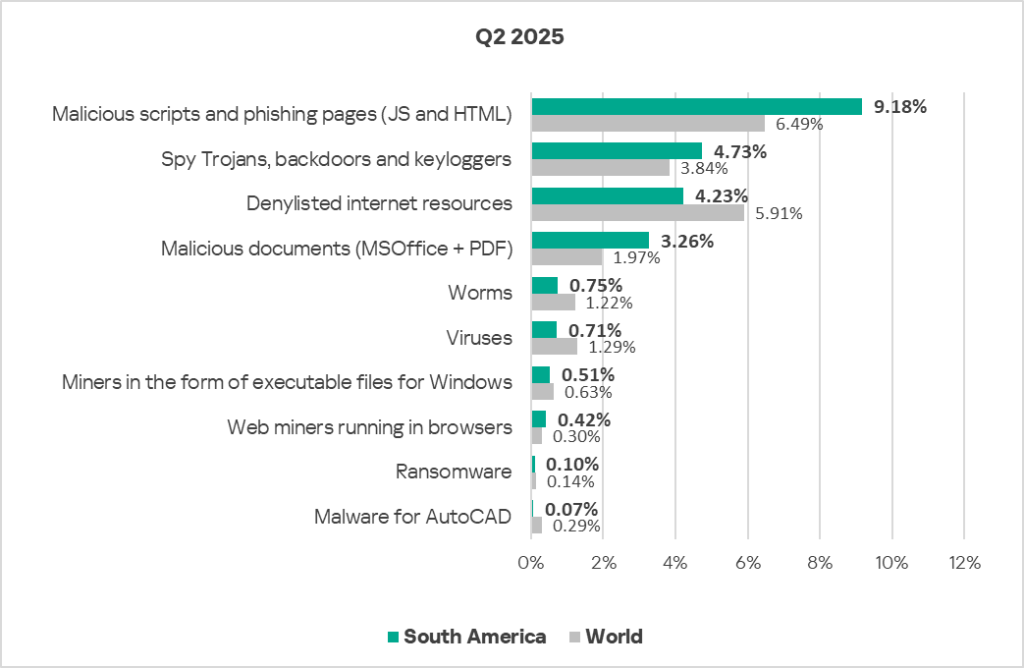
Compared to the global averages, the region has a higher percentage of ICS computers with the following categories of blocked threats:
- Malicious documents: 1.7 times higher, second place globally
- Malicious scripts and phishing pages: 1.4 times higher, first place globally
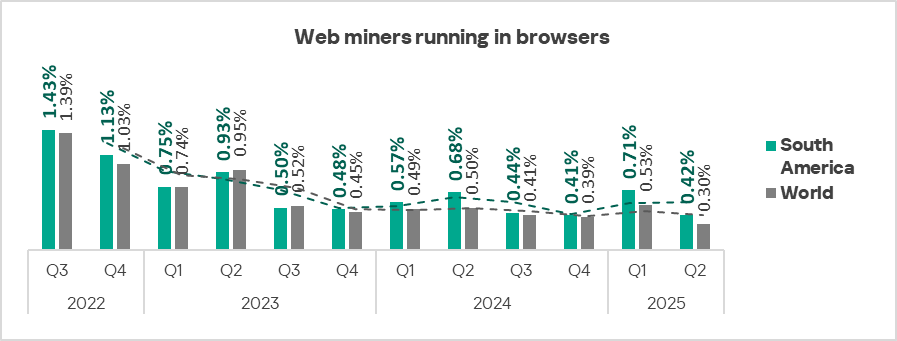
- Web miners: 1.4 times higher, second place globally
- Spyware: 1.2 times higher, with the fastest quarterly growth rate globally
Malicious scripts and phishing pages
In terms of ICS computers on which malicious scripts and phishing pages were blocked, South America leads the global ranking with 9.18%. This is three times higher than Northern Europe, which has the lowest rate.
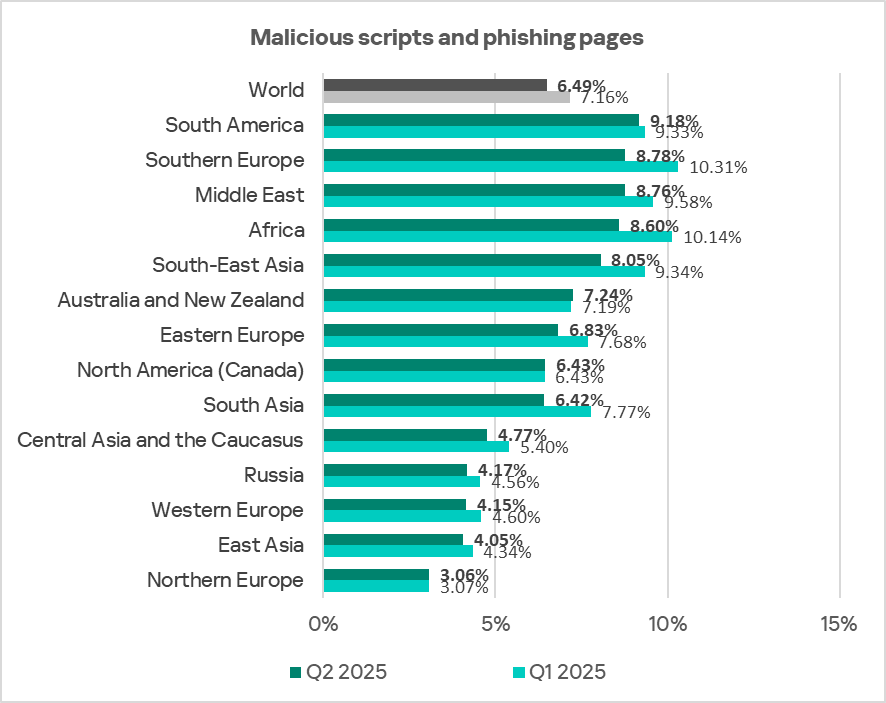
The region’s figure has declined for two consecutive quarters.
Among countries in the region, Mexico leads in this metric with 13.80%. The lowest figure is in Honduras, at 4.80%.
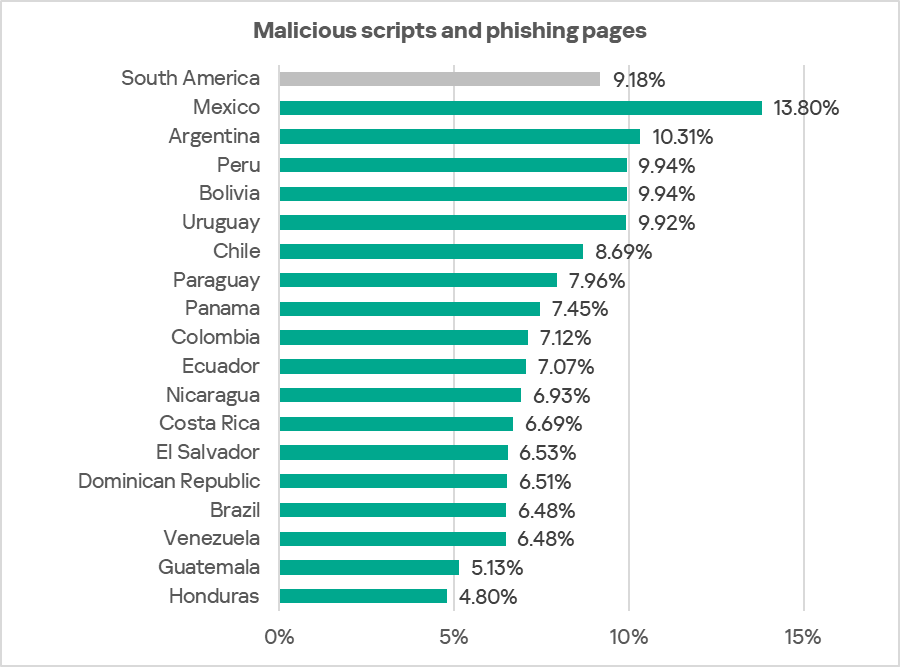
Malicious scripts and phishing pages spread both via the internet and through email.
Countries leading in the percentage of ICS computers on which these threats were blocked — Mexico and Argentina — also rank at the top for spyware and for threats blocked in email clients.
Malicious documents
Malicious documents are spread primarily via email. South America ranks second globally for ICS computers on which both email client threats and malicious documents were blocked.
The percentage of ICS computers on which malicious documents were blocked in South America has been declining for three consecutive quarters. In Q2 2025, the region’s figure was 3.26%, which is 5.1 times higher than in Northern Europe, the lowest-ranked region.
Among countries in the region, Uruguay (7.61%) and Mexico (4.99%) lead. Figures for other countries range from 1.65% in Panama to 3.17% in Chile.
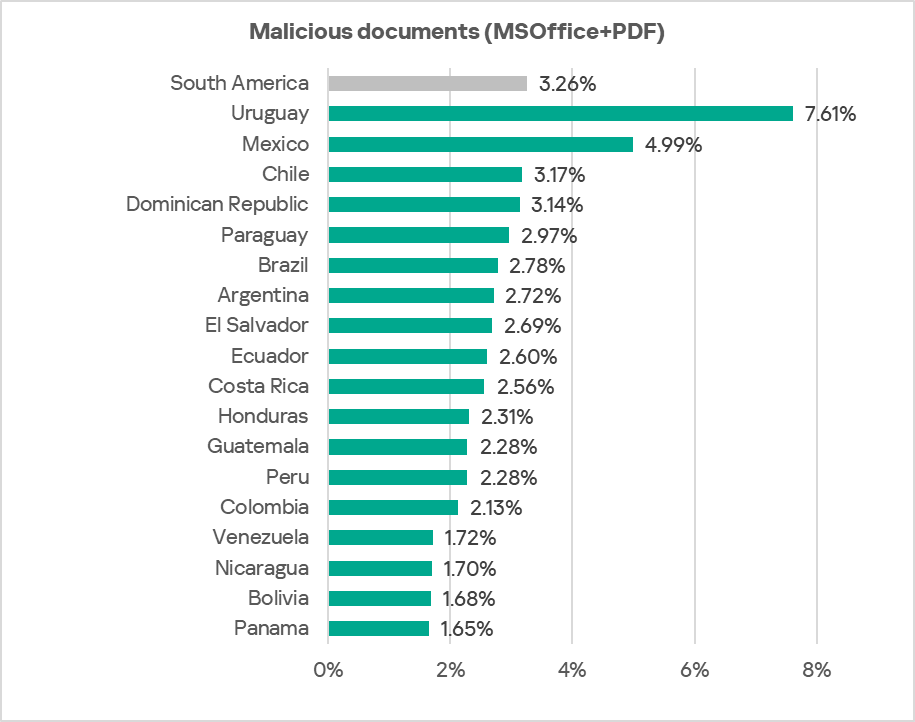
Uruguay and Mexico also top the regional ranking for ICS computers on which email client threats were blocked.
Spyware
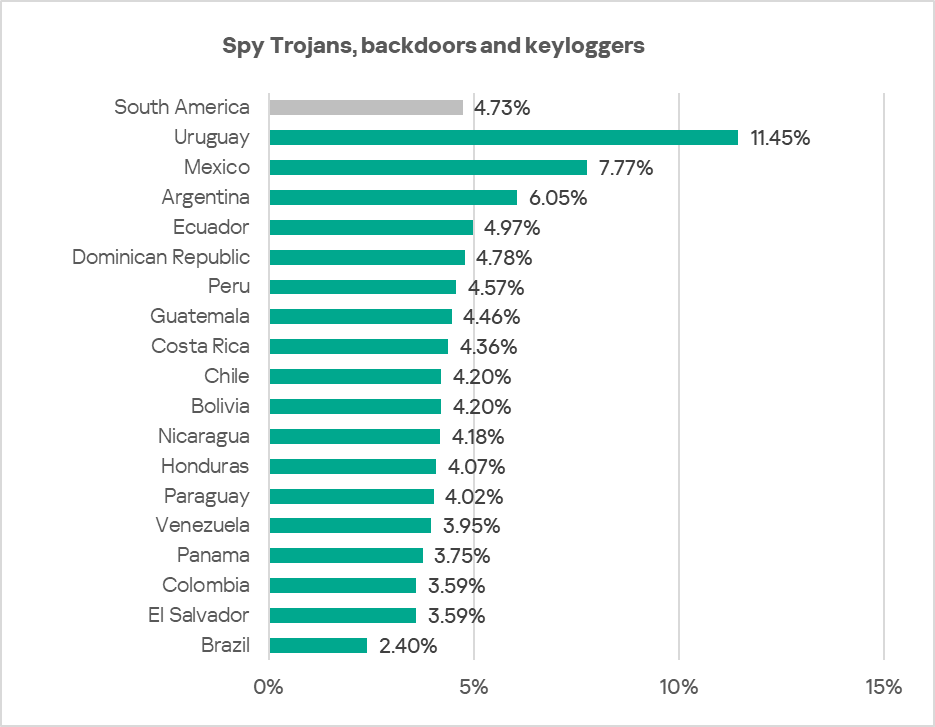
By the percentage of ICS computers on which spyware was blocked, South America ranks fifth globally with 4.73%. This is 3.4 times higher than in Western Europe, which has the lowest figure.
In the regional ranking of threat categories, spyware occupies second place. Besides South America, spyware also ranks second in two other regions — the Middle East and Southern Europe (in East Asia, it holds first place). These three regions — Southern Europe, South America, and the Middle East — also occupy the top positions globally for ICS computers on which threats from email clients were blocked.
The percentage of ICS computers in South America on which spyware was blocked fluctuates over time.
Among the region’s countries, Uruguay leads by a wide margin with 11.45%, while Brazil has the lowest rate at 2.40%.
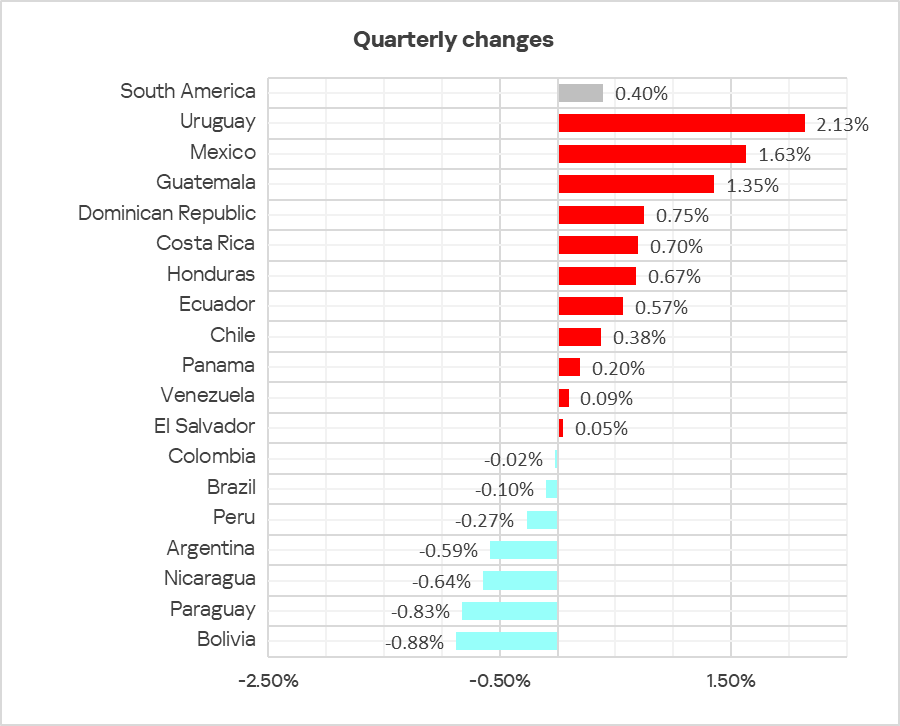
In Q2 2025, the percentage of ICS computers on which spyware was blocked grew in only two regions, with South America leading in growth. Within the region, the largest increases were recorded in Uruguay, Mexico, and Guatemala.
Spyware is blocked across all threat sources in South America but is most common in email clients.
The top three countries for spyware also rank among the region’s leaders for mail client threats.
Web miners
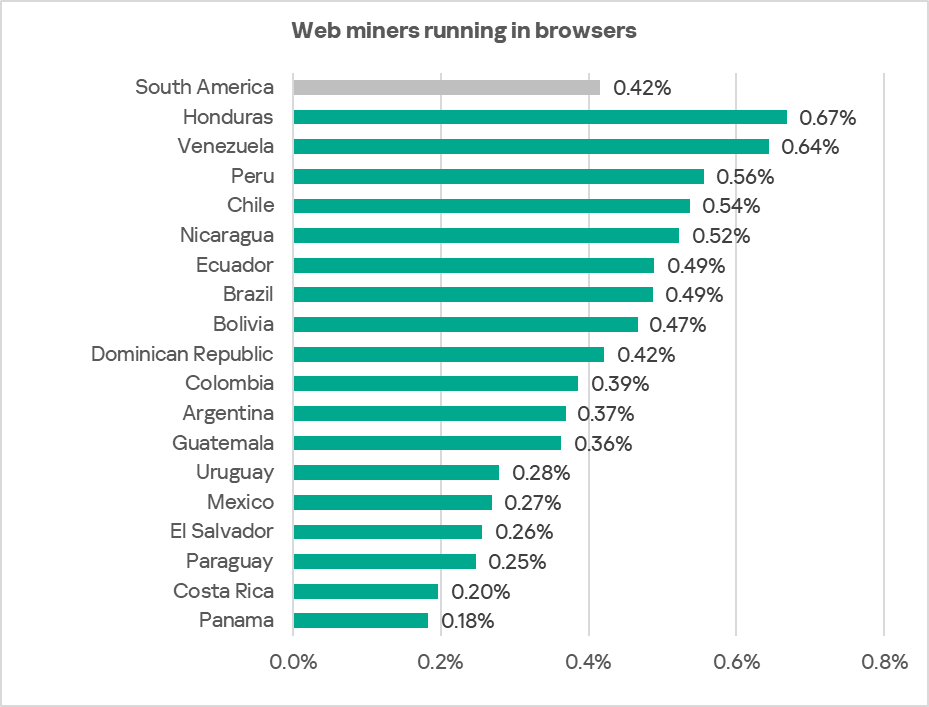
In terms of ICS computers on which web miners were blocked, South America ranks second globally with 0.42%. This is four times higher than in East Asia, which has the lowest figure.
Since Q3 2023, the region’s figure for web miners has fluctuated between 0.41% and 0.71%.
Among countries in the region, Honduras leads with 0.67%, while Panama has the lowest rate at 0.18%.
Industries
In South America, of all the industries covered in the report, malicious objects are most often blocked in biometric systems.
The percentage of ICS computers on which malicious objects were blocked exceeds the global average in three sectors: oil and gas, construction, and manufacturing.
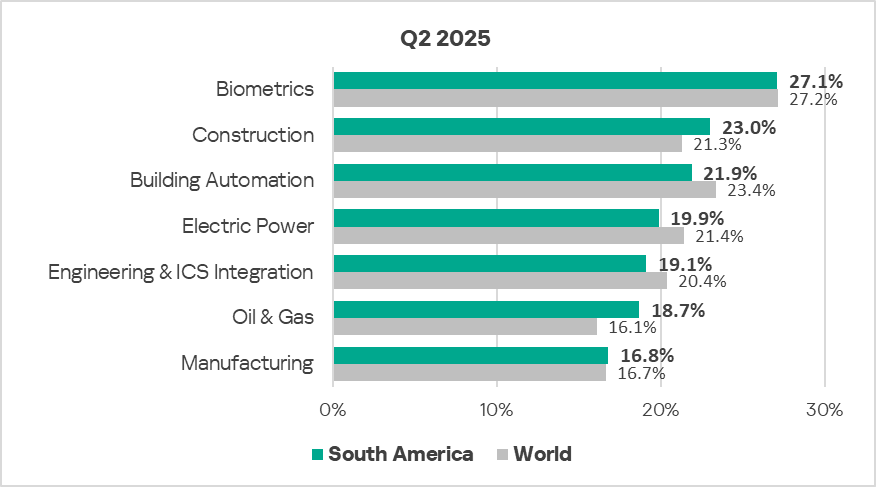
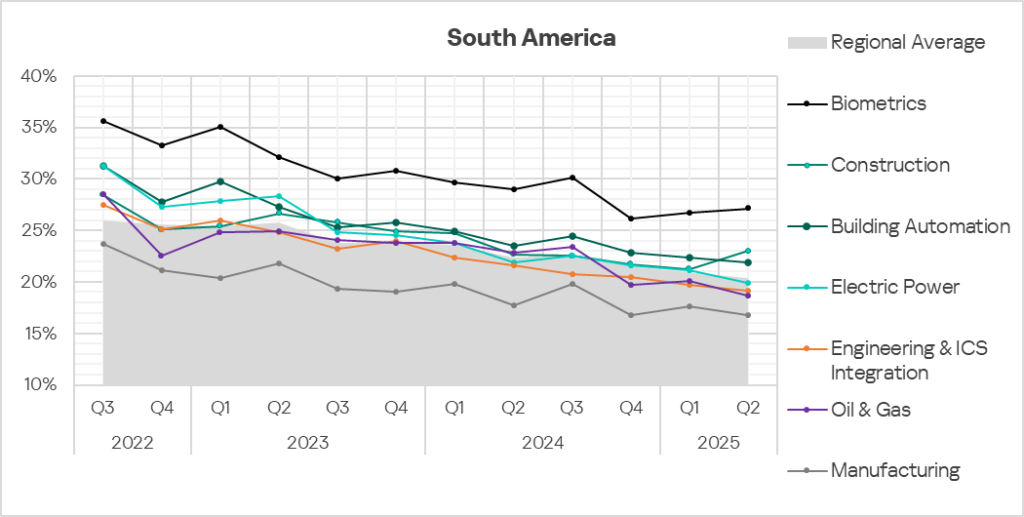
In Q2 2025, this figure increased slightly in biometric systems and in construction.
Despite fluctuations, the sectors under review show a generally positive (downward) long-term trend since Q3 2023.
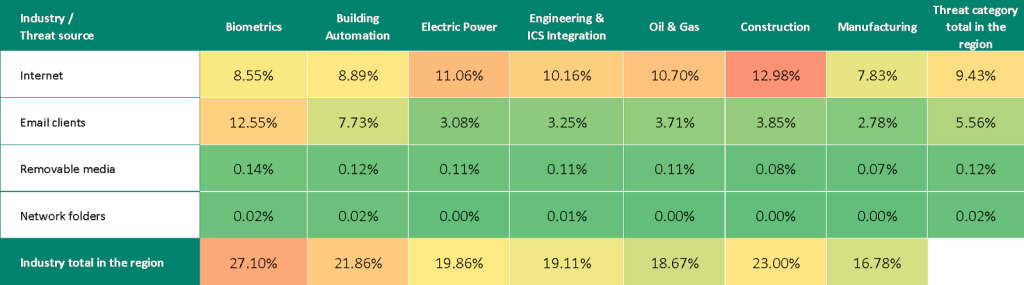
Threat sources and malware categories in industries: hot spots
We use heat maps to assess threats facing industries. On these maps, cells are colored from red to green, where red indicates the maximum value for an industry in the region, or a threat source or type across all regions and industries. In South America, near-maximum values are observed for internet threats in construction, web miners in oil and gas, as well as malicious scripts and phishing pages in biometric systems.
The heatmaps highlight industry hot spots — malware sources or categories with values higher than expected given the regional ranking of the industry or threat.
Threat source indicators for industries in South America, Q2 2025
Threat category indicators for industries in South America, Q2 2025
In all industries, the main source of threats is the internet. Therefore, the most relevant threat categories include denylisted links, malicious scripts, and phishing pages (spread both via the internet and by email).
Industry hot spots
Biometric systems
- Regional leader in threats from email clients, removable media, and network folders.
- Regional leader in malicious scripts and phishing pages, spyware, and malicious documents.
- Second place among all industries globally by the percentage of computers on which malicious scripts and phishing pages were blocked.
- Second place regionally in worms.
- Third place regionally in viruses and ransomware.
Construction
- First place regionally in internet threats; third in email client threats.
- Regional leader in viruses and malware for AutoCAD.
- Second place globally in web miners.
- Second place regionally in denylisted internet resources, miners in the form of executable files for Windows, and ransomware.
- Third place regionally for malicious scripts and phishing pages, as well as spyware.
Building automation
- Second place regionally in threats blocked in email clients, removable media, and network folders.
- Second place regionally in malicious scripts and phishing pages, spyware, and malicious documents.
- Fourth place regionally in worms and viruses.
Electrical energy industry
- Second place regionally in internet threats, third in removable media threats, and fourth in network folder threats.
- Second place regionally in viruses and malware for AutoCAD.
- Third place regionally in denylisted internet resources, worms, and both types of miners.
- Fourth place regionally in malicious scripts and phishing pages, malicious documents, and ransomware.
Engineering and ICS integrators
- Third place regionally in network folder threats. Fourth place regionally in internet threats.
- Third place regionally in malicious documents.
- Fourth place regionally in denylisted internet resources, both types of miners, and malware for AutoCAD.
Oil and gas industry
- Third place regionally in internet threats. Fourth place regionally in email client and removable media threats.
- Regional leader in denylisted internet resources, worms, both types of miners, and ransomware.
- Third place regionally in malware for AutoCAD.
Manufacturing
- Fourth place regionally in the percentage of ICS computers on which spyware was blocked.
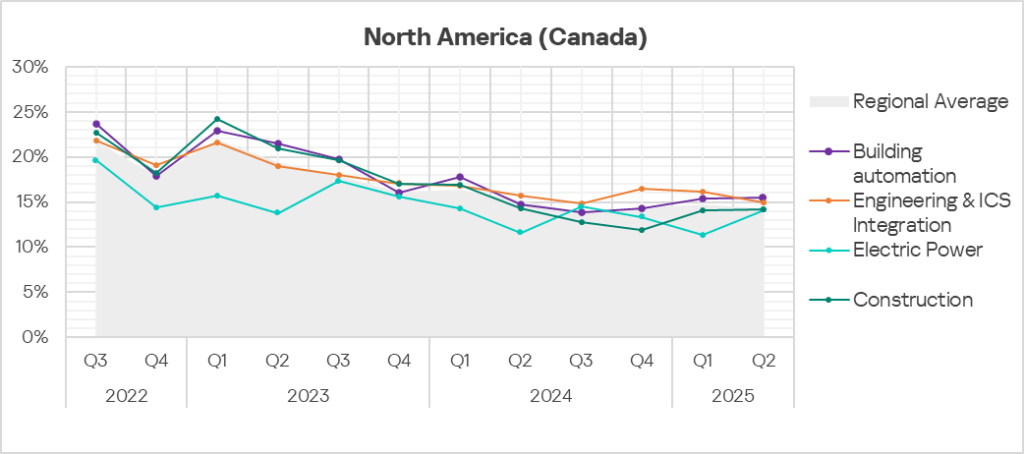
North America (Canada)
Key cybersecurity issues in the region
The cybersecurity situation in North America (Canada) is among the most favorable across all regions. The region ranked 12th in Q2 2025 based on the percentage of ICS computers on which malicious objects were blocked.
At the same time, the region was in higher positions in the relevant rankings for some threat sources and categories:
- web miners — 7th place;
- threats from email clients — 8th place;
- malicious scripts and phishing pages — 8th place;
- viruses — 8th place;
- miners in the form of executable files for Windows — 9th place.
It is obvious that computers on which web miners (which run in a web browser) were blocked are highly likely to have unprotected internet connections. It is also obvious that computers on which threats from email clients were blocked have access to an unprotected email service — in North America (Canada), spam and phishing emails containing malicious scripts and miners in the form of executable files most likely reached OT computers because these computers had access to a corporate email server that accepts emails from external sources.
North America (Canada) is one of the five regions where the percentage of internet threats increased in Q2 (second place in the ranking), as well as one of the three regions where there was a slight increase in the percentage of threats in network folders, against the backdrop of an overall decline.
In Q2 2025, North America (Canada) also ranked second among the four regions that saw an increase in the percentage of computers on which miners in the form of executable files were blocked, while in most regions, the percentage figures for this threat category decreased.
Relatively high percentage figures for threats distributed via email clients (phishing), malicious scripts, and both categories of miners may indicate that OT systems in the region are accessible to the more advanced categories of threat actors.
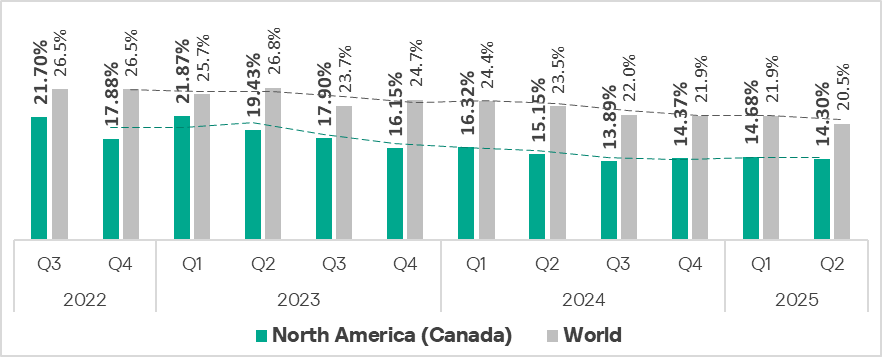
Statistics across all threats
North America (Canada) ranks 12th based on the percentage of ICS computers on which malicious objects were blocked. Its percentage value of 14.3% is significantly lower than the global average, but 1.3 times higher than that of Northern Europe, which ranks last.
Threat sources
For all threat sources except email clients, the percentage figures in North America (Canada) are below the respective global averages. The percentage of ICS computers in the region on which threats were blocked in email clients is 1.1 times higher than the global average.
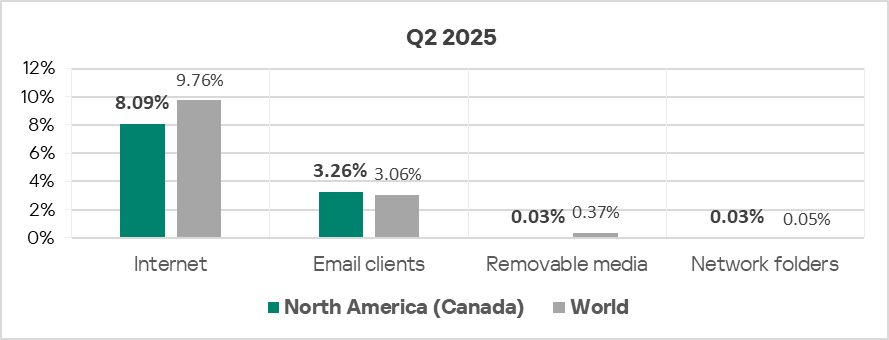
Malicious objects in the region spread primarily through the internet and email. North America (Canada) ranks last among all regions in terms of the percentage of ICS computers on which threats were blocked when removable media were connected.
In Q2 2025, the percentage of ICS computers on which malicious objects were blocked increased, among all threat sources, only for internet and email threats. North America (Canada) ranks second among regions in terms of the increase in the percentage value for internet threats.
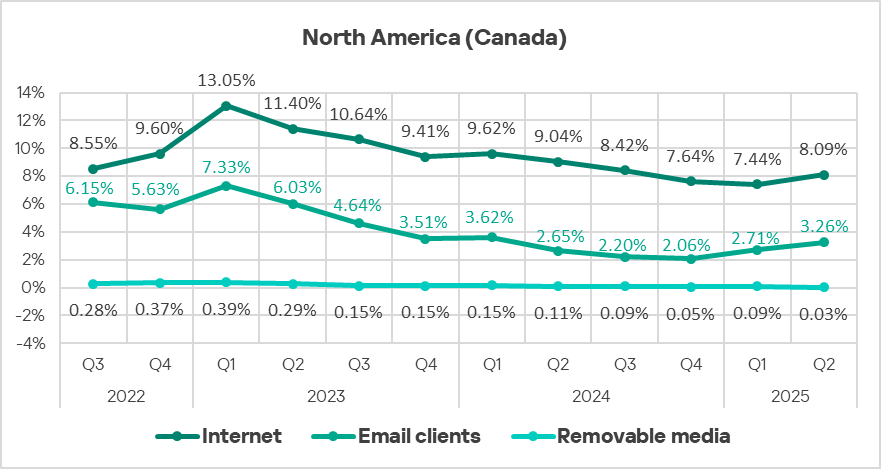
Internet
North America (Canada) ranks 11th based on the percentage of ICS computers on which internet threats were blocked, with 8.09%. This is 1.3 times higher than the lowest regional figure, recorded in East Asia.
In Q2 2025, the percentage of internet threats in the region increased, against the backdrop of a decreasing global average, marking the end of a decline that had lasted for the previous four quarters.
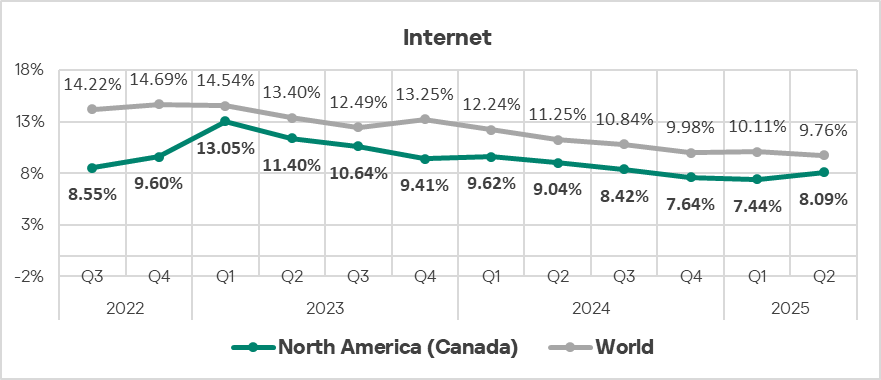
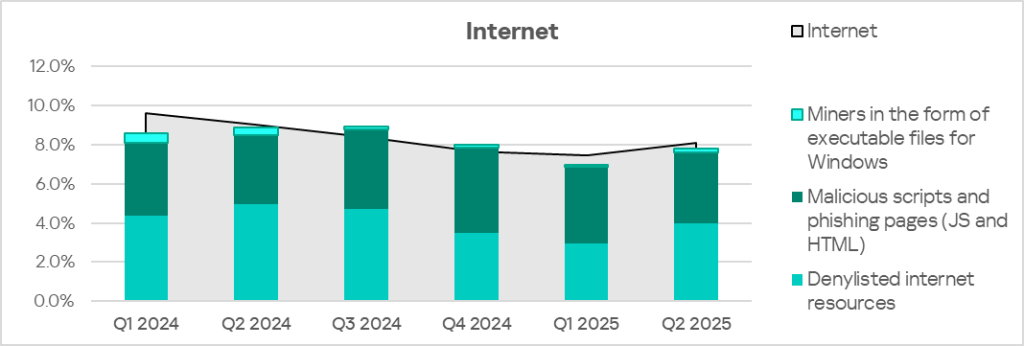
The main categories of internet threats blocked on ICS computers in the region include malicious scripts and phishing pages, as well as denylisted internet resources.
Email clients
North America (Canada) ranked 8th in Q2 2025, with 3.30%, based on the percentage of ICS computers on which threats from email clients were blocked. This is 4.1 times higher than in Russia, which ranks last in this category.
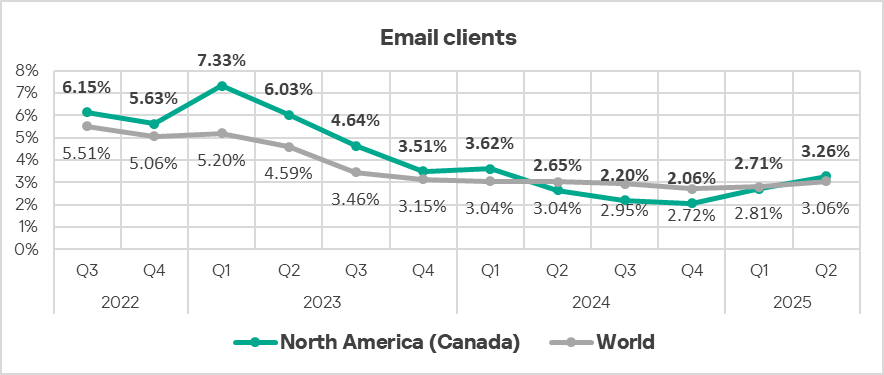
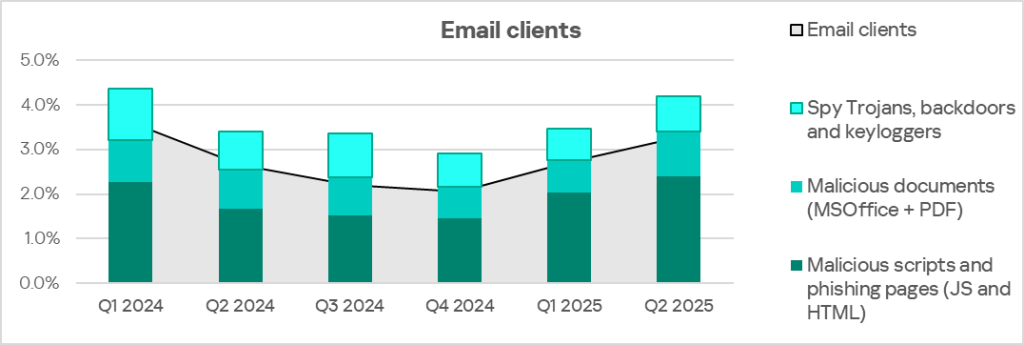
The main categories of email threats blocked on ICS computers are malicious scripts and phishing pages, malicious documents, and spyware.
Threat categories
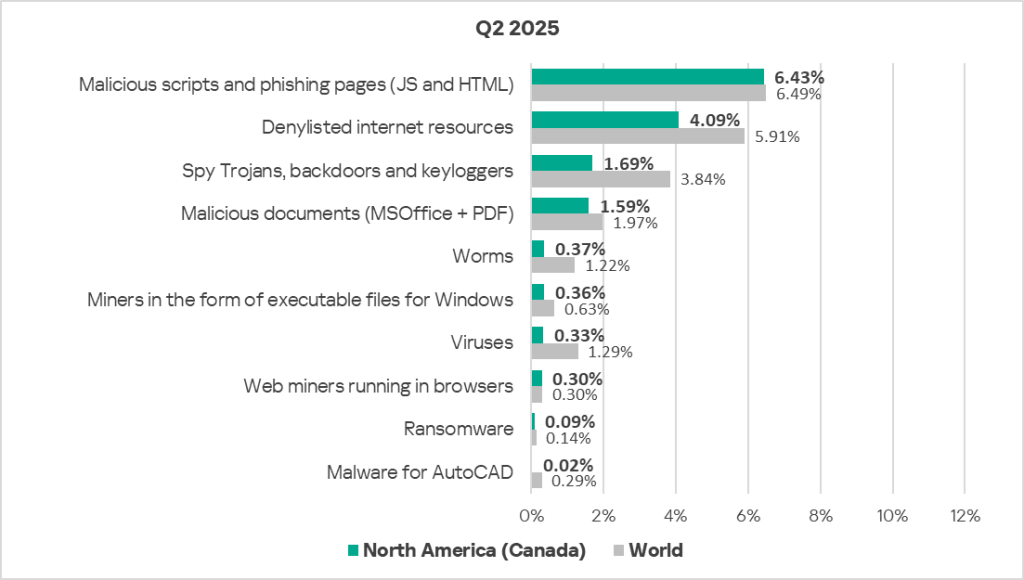
In North America (Canada), all threat category percentage values are below the respective global averages.
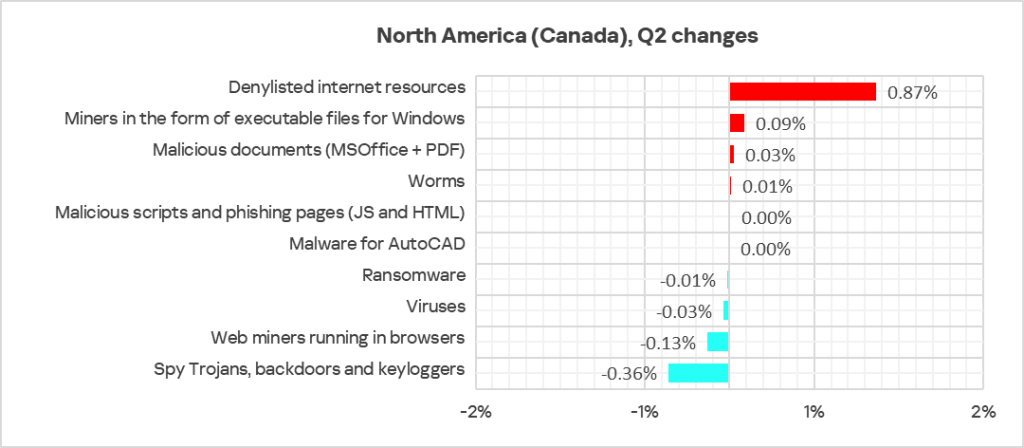
Quarter-over-quarter growth in the region was observed in four categories, but significant changes were only seen in two:
- denylisted internet resources — by a factor of 1.3;
- miners in the form of executable files — by a factor of 1.3.
Malicious scripts and phishing pages
North America (Canada) ranks eighth, with 6.43%, based on the percentage of ICS computers on which malicious scripts and phishing pages were blocked. This is 2.1 times higher than in Northern Europe, which boasts the lowest percentage among all regions.
In Q2 2025, the percentage of ICS computers on which malicious scripts and phishing pages were blocked decreased in all but two regions: North America (Canada), and Australia and New Zealand.
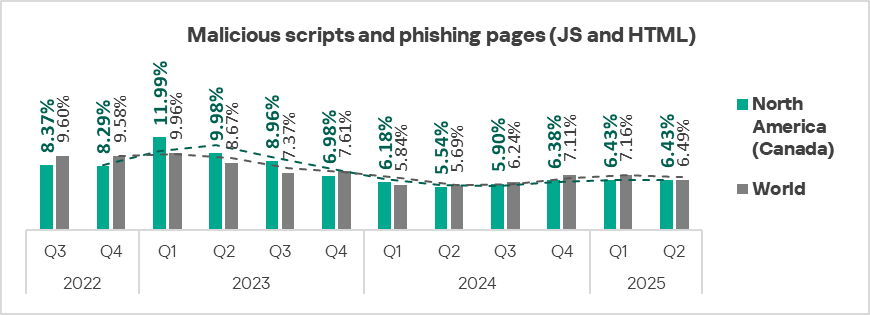
Malicious scripts and phishing pages are distributed both via the internet and by email.
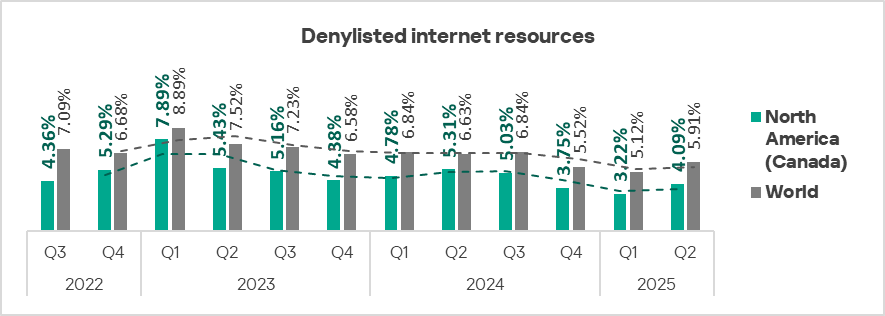
Denylisted internet resources
North America (Canada) ranks third to last among regions, with 4.09%, based on the percentage of ICS computers on which denylisted internet resources were blocked. However, the region ranks seventh in terms of the increase in this parameter — the percentage increased by a factor of 1.3 during the quarter.
Malicious documents
North America (Canada) ranks ninth among regions in terms of the percentage of ICS computers on which malicious documents were blocked. The region’s figure is 1.59% — 2.5 times higher than in Northern Europe, which ranks last.
The percentage of ICS computers on which malicious documents were blocked fluctuates in the region.
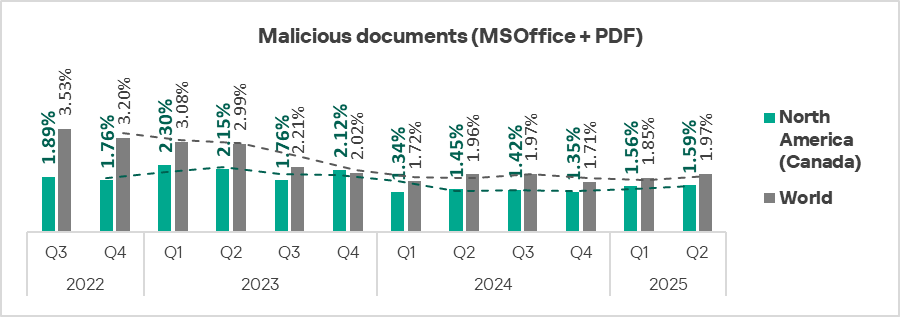
Malicious documents are distributed primarily via email.
Spyware
North America (Canada) ranks 12th among regions, with 1.69%, based on the percentage of ICS computers on which spyware was blocked. This is 1.2 times higher than in Western Europe, which has the lowest percentage value.
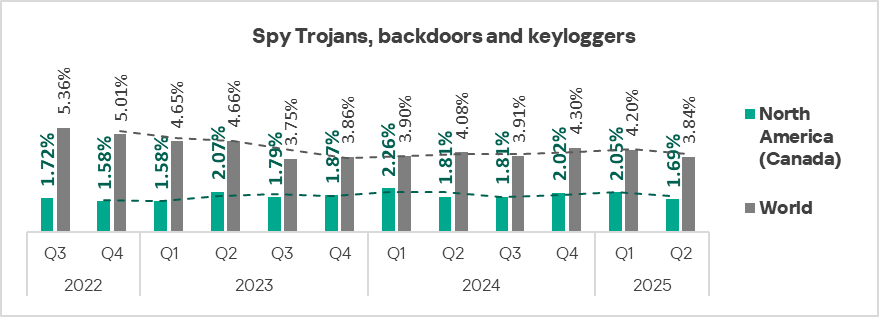
Spyware is blocked in the region across all threat sources, primarily in email clients.
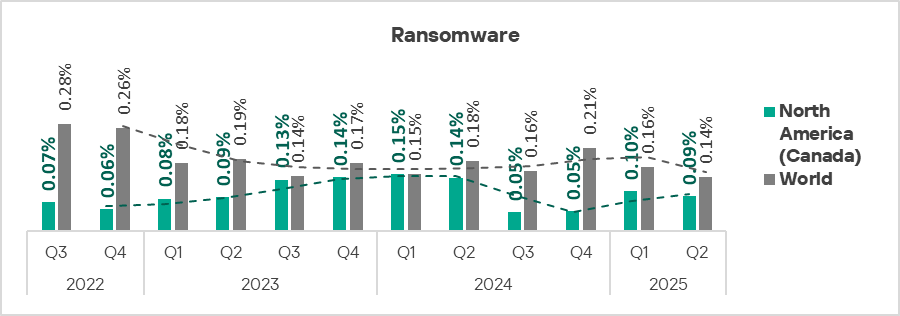
Ransomware
North America (Canada) ranks 13th, or second to last, with 0.09%, based on the percentage of ICS computers on which ransomware was blocked; this is only slightly higher than in Western Europe, which is at the bottom of the ranking.
The percentage figure in the region is growing again after a noticeable decline in the second half of 2024.
Industries
Among the industries reviewed for this report, the largest percentage of ICS computers in North America (Canada) on which malicious objects were blocked is in the manufacturing sector.
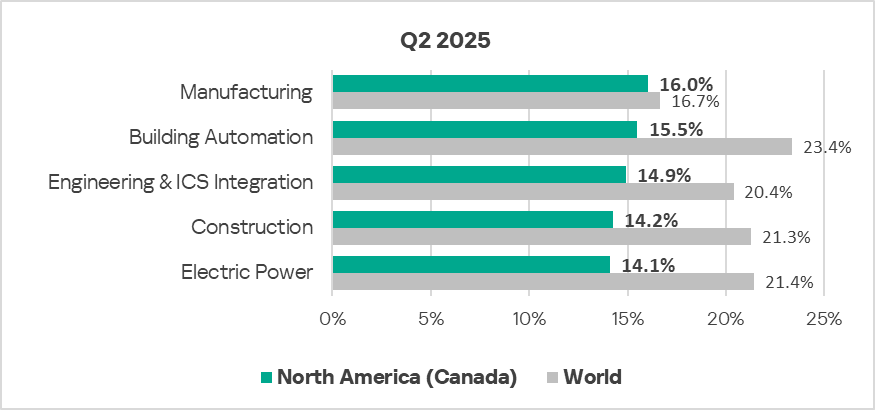
In Q2 2025, the percentage of ICS computers on which malicious objects were blocked increased significantly in the electric power sector, while it decreased in the engineering and ICS integrators sector. No significant changes were observed in other sectors.
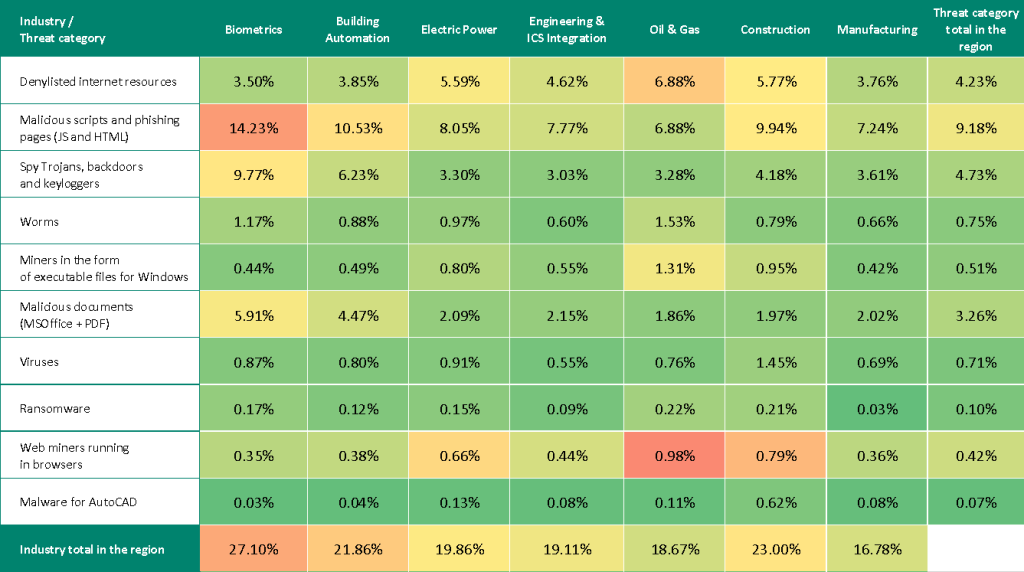
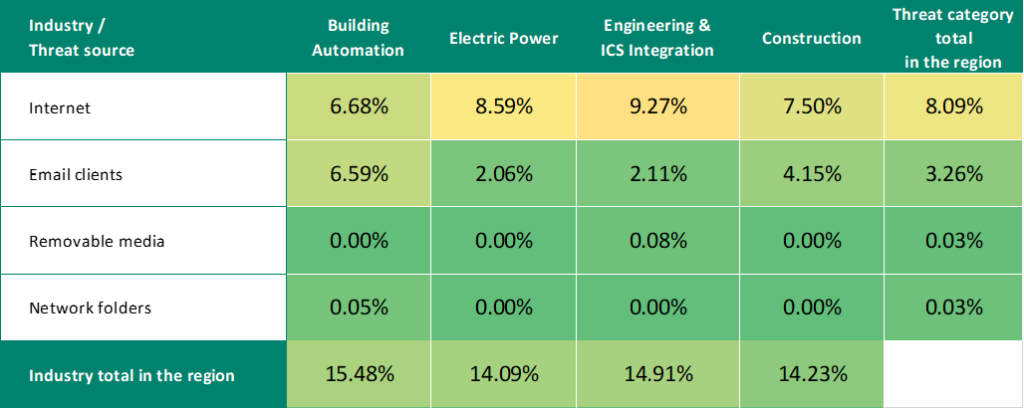
Threat sources and malware categories in industries: hot spots
We use heat maps as a tool for assessing industry-specific issues. On these maps, cells are colored in a gradient from red to green, where red indicates the maximum value for an industry in the region, or the maximum value for a threat source or threat category across all regions and industries. In North America (Canada), values close to the maximum are observed for internet threats in the OT infrastructure of the ICS engineering and integration sector.
Threat source indicators for industries in North America (Canada), Q2 2025
Threat category indicators for industries in North America (Canada), Q2 2025
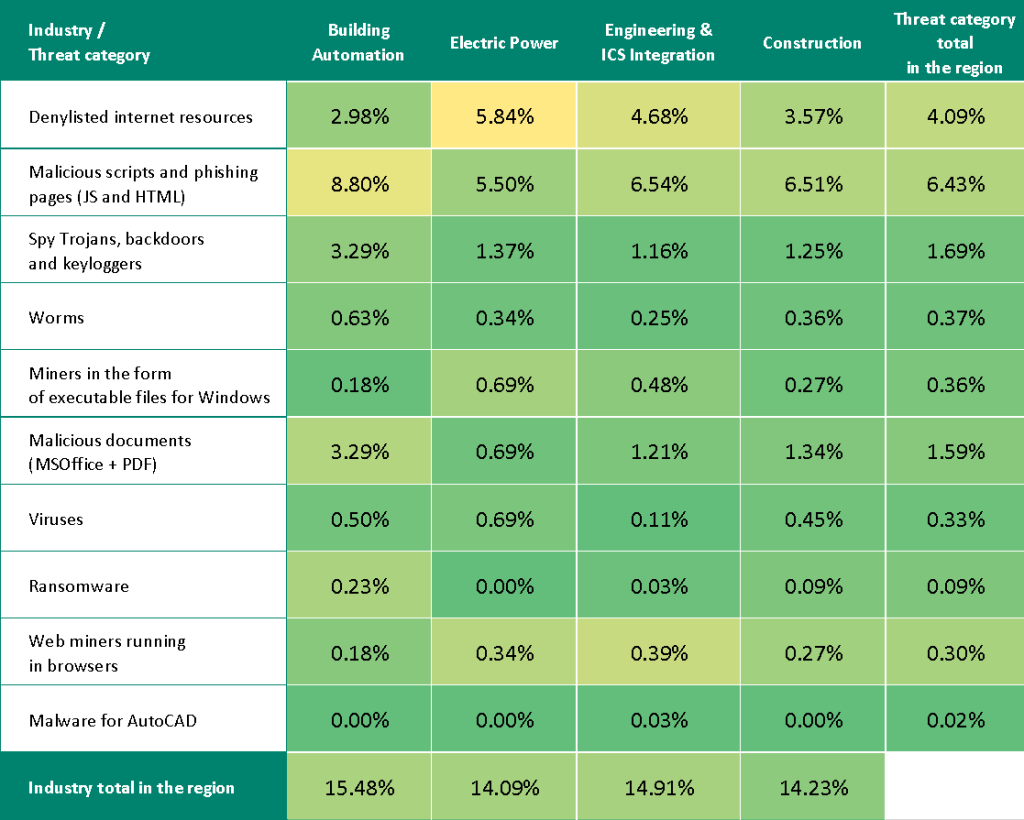
Industry hot spots
Building automation
- Ranks first among industries in the region based on the percentage of ICS computers on which threats were blocked in email clients and in network folders.
- Ranks first among industries in the region based on the percentage values for the following threat categories: malicious scripts and phishing pages, spyware, worms, malicious documents, and ransomware.
- Ranks second among industries in the region based on the percentage value for viruses.
Engineering and ICS integrators
- Ranks first among industries in the region based on the percentage of ICS computers on which threats from the internet and removable media were blocked.
- Ranks first among industries in the region based on the percentage value for web miners.
- Second position in the ranking of industries in the region based on the percentage values for the following threat categories: malicious scripts and phishing pages, denylisted internet resources, and miners in the form of executable files.
Electric power
- Top position in the ranking of industries in the region based on percentage values for the following threat categories: denylisted internet resources, viruses, and miners in the form of executable files.
- Ranks second among industries in the region based on the percentage values for spyware and web miners.
Construction
- Second place in the ranking of industries in the region based on the percentage of ICS computers on which threats were blocked in email clients.
- Second place in the ranking of industries in the region based on percentage values for the following threat categories: malicious documents, worms, and ransomware.
- Ranks third among industries in the region based on the percentage values for the following threat categories: denylisted internet resources, malicious scripts and phishing pages, spyware, viruses, and miners of both types.
Methodology used to prepare statistics
This report presents the results of analyzing statistics obtained with the help of Kaspersky Security Network (KSN). The data was received from KSN users who consented to its anonymous sharing and processing for the purposes described in the KSN Agreement for the Kaspersky product installed on their computer.
The benefits of joining KSN for our customers include faster response to previously unknown threats and a general improvement in the quality of detection by their Kaspersky installation achieved by connecting to a cloud-based repository of malware data that is not transferable to the customer in its entirety by nature of its size and the amount of resources that it uses.
Data shared by the user contains only the data types and categories described in the appropriate KSN Agreement. This data helps to a significant extent in analyzing the threat landscape and serves as a prerequisite for detecting new threats including targeted attacks and APTs1.
Statistical data presented in the report was obtained from ICS computers that were protected with Kaspersky products and which Kaspersky ICS CERT categorized as enterprise OT infrastructure. This group includes Windows computers that serve one or several of the following purposes:
- Supervisory control and data acquisition (SCADA) servers
- Building automation servers
- Data storage (Historian) servers
- Data gateways (OPC)
- Stationary workstations of engineers and operators
- Mobile workstations of engineers and operators
- Human machine interface (HMI)
- Computers used to manage technological and building automation networks
- Computers of ICS/PLC programmers
Computers that share statistics with us belong to organizations from various industries. The most common are the chemical industry, metallurgy, ICS design and integration, oil and gas, energy, transport and logistics, the food industry, light industry, pharmaceuticals. This also includes systems from engineering and integration firms that work with enterprises in a variety of industries, as well as building management systems, physical security, and biometric data processing.
We consider a computer as attacked if a Kaspersky security solution blocked one or more threats on that computer during the period under review: a month, six months, or a year depending on the context as can be seen in the charts above. To calculate the percentage of machines whose malware infection was prevented, we take the ratio of the number of computers attacked during the period under review to the total number of computers in the selection from which we received anonymized information during the same period.
- We recommend that organizations subject to restrictions on sharing any data outside the corporate perimeter consider using Kaspersky Private Security Network. ↩︎